Network Switch Impact on “Big Data” Hadoop-Cluster Data Processing Comparing the Hadoop-Cluster Performance with Switches of Differing Characteristics DR160301C March 2016 Miercom www.miercom.
Contents 1 - Introduction ........................................................................................................................................... 3 2 - Hadoop, and Measuring Hadoop Performance ....................................................................... 4 TestDFSIO ............................................................................................................................................. 5 TeraSort ..............................................................
1 - Introduction The trend is clear: Monolithic, big-iron computer performance has limits. Recent years have seen the re-deployment of massive data-processing jobs – for scientific and even business applications – onto scalable clusters of tightly networked servers.
2 - Hadoop, and Measuring Hadoop Performance This study focused primarily on the performance of several of the standard benchmark tests that are included with the Hadoop distribution to complete. We ran Hadoop release 2.7.0, the MapR distribution, from San Jose, CA-based MapR Technologies, Inc. Concurrently, the testers carefully monitored the percent buffer utilization of each of the Leaf switches; see the following test-bed section, to which all the computing nodes directly connected.
As explained more in the following Test Bed section, three different switches were tested. That means the test bed was built, the first time with a pair of Cisco Nexus 9272Q switches, and all the tests were run. Then the two switches were replaced with a pair of Cisco Nexus 92160YC switches, and all the tests were re-run, in the same order and in exactly the same way.
TeraSort TeraSort is a popular benchmark test that measures the amount of time it takes a computing node to sort one terabyte of randomly distributed data. Its purpose is to sort a large amount of data as fast as possible. TeraSort simulates a typical big-data workload that reads from disk, performs intensive processing, and then writes back to disk – imposing stress on I/O as well as processing elements. TeraSort is commonly used to measure the MapReduce performance of a Hadoop cluster.
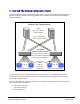
3 - Test Bed: The Hadoop Configuration Tested To see how different switch-routers affect performance in terms of the Hadoop benchmark tests applied, a realistic test bed representing a data-center network infrastructure was assembled, see below diagram. Hadoop Test Configuration Spine: Two Cisco Nexus 9504 switches Four 40-Gbps links Connect Spine to Leafs Leaf Nodes: Three test environments: ● Two Cisco Nexus 9272Q’s ● Two Cisco Nexus 92160YC’s ● Two Arista 7280SE-72’s CN ...
The leaf switches connected to a total of 63 blade servers in Cisco UCS C200 High-Density RackMount Server systems. One switch connected 31 servers, each via a 10-Gbit/s link. The other switch similarly connected 32 servers. Though 63 servers were available, only 58 took an active role in the Hadoop configuration at a time. For the Hadoop configuration, each server – or Computing Node (CN) – had three 2-TB disks assigned to Hadoop.
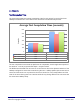
4 - Results Test Completion Time The chart below shows the average completion times for each switch, for each of the three Hadoop benchmark tests. Each test for each switch was conducted multiple times.
Other Key Observations As noted, several other switch metrics were observed and recorded in addition to the Hadoop benchmark tests. Among the key observations: Buffer utilization was low across the board, for all the switches tested, during the Hadoop benchmark tests. The throughput achieved during the tests were typically around 1Gbps, but less than line rate. Disk I/O reads and writes, consumed the most time in the tests.
Line rates. Link utilization (load) and disk I/O rates were also monitored during test runs. The maximum and average link loads – of the 10-Gbit/s capacity available to each server, are shown below for the three switches for the TeraGen tests.
5 - Conclusions Big Data does not need big buffers o With the benchmarks that were run as part of this study, there was no discernable difference in the performance of the cluster with different switching platforms. Performance was measured primarily as job completion time for the DFSIO, TeraGen and TeraSort tests. o A large buffer is not required for dealing with the Hadoop tests. All buffer-occupancy figures revealed that average and maximum buffer utilization in all Hadoop test cases were very low.
6 – References Why flow-completion time is the right metric for congestion control http://yuba.stanford.edu/techreports/TR05-HPNG-112102.pdf Experimental Study of Router Buffer size http://yuba.stanford.edu/~nickm/papers/IMC08_buffersizing.pdf On the Data Path Performance of Leaf-Spine Datacenter Fabrics https://people.csail.mit.edu/alizadeh/papers/hoti13.pdf DCTCP: Efficient Packet Transport for the Commoditized Data Center http://research.microsoft.com/pubs/121386/dctcp-public.
7 - About Miercom Testing This report was sponsored by Cisco Systems, Inc. The data was obtained completely and independently by Miercom engineers and lab-test staff as part of our performance verification testing. Testing such as this is based on a methodology that is jointly co-developed with the sponsoring vendor. The test cases are designed to focus on specific claims of the sponsoring vendor, and either validate or repudiate those claims.