
Instruction manual


Chapter 4: NetScaler Statistical Utility
4-6 NetScaler 9000 Series Installation and Configuration Guide - Volume 1
NSICG60_JAN05
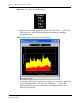
The following NetScaler Dashboard applet screen is displayed in your
browser after the data is successfully fetched and processed:
Figure 4-4 The NetScaler Dashboard Screen.
4.3 Understanding Graphs and Legends
There are two different categories of Chart Types:
1. Fill Pattern: Bar, Stacked Bar, Area, Stacked Area and Pie chart types fall
under this category;
Hence the charts in the middle row shown in the image have Area and Bar
chart types respectively. So the legend depicts the color chosen to fill /
draw the plot area for its respective plot item.