
Instruction manual


Chapter 4: NetScaler Statistical Utility
NetScaler 9000 Series Installation and Configuration Guide - Volume 1 4-7
NSICG60_JAN05
2. Line Pattern: Line chart type (among those made available in Dashboard
5.0 to the user) falls under this category;
The lines that are drawn using the plot points can have symbols (Circle,
Diamond, Cross, Square, Rhombus etc. including NONE) to depict the
plot points on a given plotted line. From the usability point of view it is
helpful for the user to have symbols on the lines drawn to easily
distinguish between data plot points and connector lines between two data
plot points. The symbol shown in the legend painted with chosen color, is
the symbol used on the drawn line to depict a plot point and the color used
to fill symbol shape is the color used to show the respective plotted item.
4.4 Dashboard Components
Dashboard consists of 7 main components (panels). They are:
z CPU Utilization Panel
z Memory Utilization Panel
z System Throughput Panel
z Requests Per Second Panel
z System Log Panel
z Global Statistics Panel
z Feature Statistics Panel
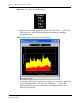
4.4.1 CPU Utilization Panel
The CPU Utilization panel reflects the NetScaler system’s current CPU
utilization as a percentage. The user can plot the CPU Utilization statistics in a
graph.