
Instruction manual


Chapter 4: NetScaler Statistical Utility
4-8 NetScaler 9000 Series Installation and Configuration Guide - Volume 1
NSICG60_JAN05
Figure 4-5 The CPU Utilization Panel.
To plot the CPU Utilization statistics in a graph/chart:
1. Right-click on the CPU Utilization Panel and select the “Plot…” option.
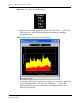
The following chart is displayed:
Figure 4-6 Plotting chart for CPU Utilization.
2. To change the chart type, right-click on the “Plotting: CPU Utilization”
window and select the “Change Chart Type” option.
3. To show the grid lines on the chart, right-click on the Plotting chart and
select the “Show Grid” option. To hide the grid lines on the chart,
right-click on the Plotting chart and select the “Hide Grid” option.