
Instruction manual


Chapter 4: NetScaler Statistical Utility
4-10 NetScaler 9000 Series Installation and Configuration Guide - Volume 1
NSICG60_JAN05
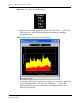
Figure 4-8 Plotting chart for CPU Utilization.
2. To change the chart type, right-click on the “Plotting: Memory
Utilization” window and select the “Change Chart Type” option.
3. To show the grid lines on the chart, right-click on the Plotting chart and
select the “Show Grid” option. To hide the grid lines on the chart,
right-click on the Plotting chart and select the “Hide Grid” option.
4.4.3 System Throughput Panel
The System Throughput Panel depicts NetScaler 9000 system’s throughput in
terms of incoming and outgoing traffic passing through the NetScaler 9000
system.