
Instruction manual


Chapter 4: NetScaler Statistical Utility
NetScaler 9000 Series Installation and Configuration Guide - Volume 1 4-11
NSICG60_JAN05
Figure 4-9 The System Throughput Panel.
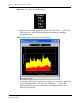
1. Right-click on the Throughput Panel and select the “Plot…” option. The
following chart plots both the incoming throughput and outgoing
throughput values
Figure 4-10 Plotting chart for System Throughput.
To view the comparative throughputs of all interfaces in NetScaler, right-click
on the Throughput Panel and select the “Drilldown…” option. The
following chart displays the comparative throughputs for each of the
interface in NetScaler.