
Instruction manual


Chapter 4: NetScaler Statistical Utility
NetScaler 9000 Series Installation and Configuration Guide - Volume 1 4-13
NSICG60_JAN05
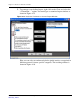
4.4.4 Requests per second Panel
This panel reflects the current requests per second served by the NetScaler
9000 system.
Figure 4-12 The Requests per second Panel.
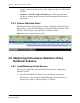
4.4.5 System Log Panel
The System Log panel displays all events logged in the system since the
Dashboard was launched. The text on the top of this panel shows the
timestamp since when the NetScaler system that is being monitored has been
up and running.
Figure 4-13 The System Log Panel.
Click on the Help button to launch Online Help system for the NetScaler
Dashboard
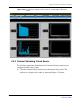
4.4.6 System Global Statistics Panel
The Global Statistics panel captures the NetScaler 9000 system’s global
statistics. These statistics are categorized into different groups, such as:
z HTTP
z TCP
z SSL
z ICache (Integrated Cache)