
Instruction manual


Chapter 4: NetScaler Statistical Utility
4-14 NetScaler 9000 Series Installation and Configuration Guide - Volume 1
NSICG60_JAN05
z Compression
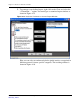
Figure 4-14 The Global Statistics Panel.
1. To plot a statistic on the chart, click the drop-down list provided at the top
of the Global Statistics Panel. Select the desired statistic. On selection, the
chart plots the selected statistic. The “details” panel displays performance
data of all the statistics falling under the parent group of the selected
statistic.
The meaning of the columns in the Details Panel is as follows:
l Total: Displays the cumulative total of the selected statistic.
l Delta: Displays the recent changes in the statistic’s value since the
last refresh (usually since last 7 seconds).
l Rate: Displays the statistic’s rate per second.
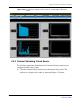
2. To change the chart type, right-click on the Chart and select the “Change
Chart Type” option. The chart types are Line, Bar, Area, Stacked Bar and
Stacked Area.
3. To show the grid lines on the chart, right-click on the chart and select the
“Show Grid” option. To hide the grid lines on the chart, right-click on the
Plotting chart and select the “Hide Grid” option.
4. To change the value of units in the chart, right-click on the Chart and
select the “Plot Statistic Unit” option. The supported units are Total, Delta
and Rate.
Note: For certain statistics the unit selection may be disabled.