
Instruction manual


Chapter 4: NetScaler Statistical Utility
NetScaler 9000 Series Installation and Configuration Guide - Volume 1 4-15
NSICG60_JAN05
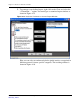
5. To generate a user-defined report, right-click on the Chart and select the
“Custom Plot…” option. You would get a customized report window as
shown in Figure 4-15.
Figure 4-15 NetScaler Performance Custom Report Window.
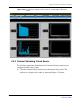
Here you can select at random and plot the global statistics categorized in
different protocol / feature specific categories. The resulting window is
shown in Figure 4-16: