
Instruction manual


Chapter 4: NetScaler Statistical Utility
4-16 NetScaler 9000 Series Installation and Configuration Guide - Volume 1
NSICG60_JAN05
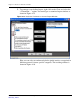
Figure 4-16 NetScaler Performance Custom Report Window.
Compression Benefits
Compression statistics monitoring is categorized into 2 groups namely:
z Content Compression: The statistics in this category pertains only to
those web resources that are successfully compressed by the Netscaler
system. Examples of those objects are text files like HTML or ASP files.
z Overall Compression: The statistics in this category pertains to the
entire web resources served by the Netscaler system. This includes
resources that are successfully compressed by the system and those that
may not be compressed. Some files like JPEGs, GIFs are already
compressed and these may not be compressed again by the Netscaler
system.
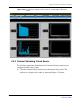
The following plots are available to monitor compression benefits
z Compressible vs. Compressed data: This graph belongs to “Content
Compression” category and plots throughput of compressible data before
and after compression. Supported units are Total, Delta and Rate.
z UnCompressed vs. Overall Compressed Data: This graph belongs to
“Overall Compression” category and plots throughput of the overall