
Instruction manual


Chapter 4: NetScaler Statistical Utility
4-18 NetScaler 9000 Series Installation and Configuration Guide - Volume 1
NSICG60_JAN05
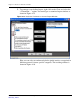
Figure 4-18 Load Balancing Statistics in a Tabular Form.
2. To plot the statistics displayed in the table, select the target row by
left-clicking on it and then right click on the desired load balancing virtual
server from the table and select the “Plot…” option. This action can also
be achieved through double-clicking on the target row. The following
chart is displayed plotting various statistics under this load balancing
virtual server.
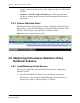
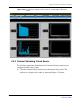
Figure 4-19 Performance statistics of a Load Balancing Virtual Server.
3. To plot services bound to a load balancing virtual server, select the target
row by left-clicking on it and then right click on the desired load