
Instruction manual


Chapter 4: NetScaler Statistical Utility
NetScaler 9000 Series Installation and Configuration Guide - Volume 1 4-19
NSICG60_JAN05
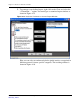
balancing virtual server from the table and select the “Services…” option.
The following chart is displayed plotting various statistics for all the
services bound to this load balancing virtual server.
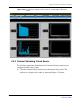
Note: An additional Pie chart type is available to view the distribution of the
load over different services bound to the target Load balancing
Virtual Server.
a. To further plot only a single service, select the target row by
left-clicking on it and then right click on the desired service from the
table and select the “Plot…” option. This action can also be achieved
through double-clicking on the target row.