
Instruction manual


Chapter 2 Installation, Configuration and Management
NetScaler 9000 Series Installation and Configuration Guide - Volume 1 2-9
NSICG60_DEC04
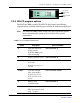
Figure 2-12 LCD displays Network Traffic Statistics
1 The first line displays the rate of the Received data in Megabits per
second.
2 The second line displays the rate of Transmitted data in Megabits per
second.
CPU Load, Memory and Connections Screen
The NetScaler 9000 system LCD displays the CPU Load, Memory and
the Total Connections statistics as shown in the following figure:
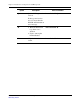
Figure 2-13 LCD displays CPU Load, Memory and Total Connections statistics
1 The first line displays the following information:
z CPU utilization in percentage
z memory utilization in percentage
2 The second line displays the number of Server / Client connections.
Note: If the Server / Client total connections exceed 99,999 for server
connections and 999,999 for client connections then the number of
connections are displayed in thousands (with a suffix 'K').
Port Information
The LCD in the NetScaler 9000 system is divided into four quadrants. Every
quadrant contains a specific symbol and have five fixed spaces for per port
information. The spaces are numbered from left to right as
0/1, 1/1, 1/2,
1/3, 1/4
corresponding to the port numbering schema.