
User`s manual


ThinkCore IA241/240 Linux User’s Manual Development Tool Chains
5-3
size Lists object file section sizes
strings Prints strings of printable characters from files (usually object files)
strip Removes symbols and sections from object files (usually debugging information)
On-Line Debugging with GDB
The tool chain also provides an on-line debugging mechanism to help you develop your program.
Before performing a debugging session, add the option -ggdb to compile the program. A
debugging session runs on a client-server architecture on which the server
gdbserver is installed
int the targe computer and the client ddd is installed in the host computer. We’ll asuumne that you
have uploaded a program named hello-debug to the target computer and strat to debug the
program.
1. Log on to the target computer and run the debugging server program.
#gdbserver 192.168.4.142:2000 hello-debug
Process hello-debug created; pid=38
The debugging server listens for connections at network port 2000 from the network interface
192.168.4.142. The name of the program to be debugged follows these parameters. For a
program requiring arguments, add the arguments behind the program name.
2. In the host computer, change the directory to where the program source resides.
cd /my_work_directory/myfilesystem/testprograms
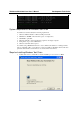
3. Execute the client program.
#ddd --debugger arm-linux-gdb hello-debug &
4. Enter the following command at the GDB, DDD command prompt.
Target remote 192.168.4.99:2000
The command produces a line of output on the target console, similar to the following.
Remote debugging using 192.168.4.99:2000
192.168.4.99 is the machine’s IP address, and 2000 is the port number. You can now begin
debugging in the host environment using the interface provided by DDD.
5. Set a break point on main by double clicking, or by entering
b main on the command line.
6. Click the cont button.
Windows Tool Chain
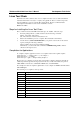
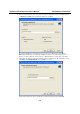
The Windows tool chain is a cross development environment that simulates the Linux root file
system, allowing users to develop applications in a Windows PC environment. The following
figure shows an example of what the tool chain looks like.
/
Your group is currently “mkpasswd”. This indicates that
The /etc/passwd (and possibly /etc/group) files should be rebuil
See the man pages for mkpasswd and mkgroup then, for example, ru
mkpasswd –l [-d] > /etc/passwd
mkpasswd –l [-d] > /etc/group
Note that the –d switch is necessary for domain users.
stephen_lin@abc-06d82fcbf1a /
$ ls –al
total 9
drwxr—xr-x 8 stephen_ mkpasswd 0 Jan 10 17:24 .
drwxr—xr-x 8 stephen_ mkpasswd 0 Jan 10 17:24 ..
drwxr—xr-x 2 stephen_ mkpasswd 0 Jan 10 19:48 bin
drwxr—xr-x 7 stephen_ mkpasswd 0 Jan 10 19:24 etc