
User manual


Chapter 5: Server Management
152 Cobalt RaQ XTR User Manual
• Historical Use—This graphically represents the total network traffic
broken down by specific day, week or month during the report period.
These statistics can help you determine the busiest specific day, week or
month for network traffic on your RaQ XTR server.
• Download log file—This allows you to download the current network
traffic log file. You can then analyze the log file with external analysis
software.
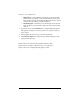
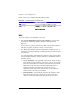
3. To generate a report, click Customize. The “Configure Reporting Options”
table appears; see Figure 71. You can generate a new report for a selected
range of dates.
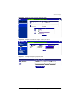
4. From the pull-down menus, choose a start date and end date.
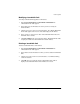
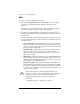
5. Click Generate Report. The “Network Usage Summary Statistics” table
appears with the new data.
Figure 69 shows the “Network Usage Summary Statistics” table.
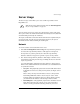
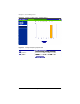
Figure 70 shows a sample of a Network Usage – Use by IP report.
Figure 71 shows the “Configure Reporting Options” table.