
User manual


Chapter 5: Server Management
158 Cobalt RaQ XTR User Manual
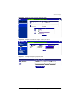
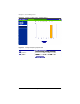
Figure 75 shows the “Configure Reporting Options” table.
Figure 75. Configure Reporting Options table
Mail
To view the statistics for email traffic on the server:
1. Select Server Management > Server Usage > Mail. If a report has been
generated, the “Mail Usage Summary Statistics” table appears. See
Figure 76.
If a report has not yet been generated, the “Mail Usage Summary Statistics”
table does not appear. To generate a report, see Step 3 below.
2. The “Mail Usage Summary Statistics” table displays a number of rows of
information concerning email usage, including the dates for which the report
was generated.
A second table entitled “Other Mail Usage Statistics” offers hypertext links
for more detailed information. Click on a link to see a detailed bar chart for a
particular criterion.
• Use by Virtual Site—This graphically represents the amount of email
traffic broken down by virtual site on the server. You can view statistics
based on which domains sent email and which domain received email.
Mail traffic that has been relayed through the RaQ XTR server or
destined for domains other than those served by this server is
summarized in this report. These statistics show you the volume of
email sent and received by a given domain.
• Periodic Reports—This graphically represents the cumulative email
traffic broken down by hour of the day or day of the week. These
statistics can help you determine the busy periods for your server.