
Specifications


www.pulsar.pl PowerSecurity
17
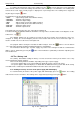
5.2 The „Diagrams” tab
The ”Diagrams” tab enables reading the history of the parameters (current, voltage) stored in the internal
memory of the PSU and reading the values from the charts. The ”Diagrams” tab is available only for power supplies
with LCD display.
During normal operation, the PSU records the voltage and current values at the AUX output circuit and
saves them in the internal nonvolatile memory. Recording is performed at 5 minute intervals and the memory
capacity allows for about 6100 entries. The data is stored in the circular buffer: when the memory is full, the oldest
entries are overwritten by the new ones.
Fig. 17. The „Diagrams” tab.
To read the internal memory of the power supply, press the button in the upper left corner. Depending
on the amount of data recorded, the reading can take from a few seconds up to several minutes. The reading starts
from the most recent entries and its progress is displayed as a percentage value. The reading can be stopped at
any time by pressing the button.
The diagram presents the following parameters:
- Uaux1 avg - AUX1 output voltage (mean value within 5 minutes)
- Uaux1 min - minimum output voltage at the AUX1
- Uaux1 max - maximum output voltage at the AUX1
- Uaux2 avg - AUX2 output voltage (mean value within 5 minutes)
- Uaux2 min - minimum output voltage at the AUX2
- Uaux2 max - maximum output voltage at the AUX2
- Uac avg - mains supply (mean value within 5 minutes)
- Uac min - minimum mains supply
- Uac max - maximum mains supply
- Ubat - battery voltage (mean value within 5 minutes)
- Ubat min - minimum battery voltage
- Ubat max - maximum battery voltage
- Iaux - total output current (mean value within 5 minutes)
- Iaux max - maximum total output current
- Iaux min - minimum total output current
- Tbat - battery temperature
- Rbat - resistance of the battery circuit
The chart’s color corresponds to the color of the label located below.
To indicate whether the individual minimum, maximum or average values should be visible on the diagram, use the
toolbar icons, e.g. .