
System information
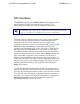

VQM Statistics Menu
Voice quality monitoring (VQM) allows real time passive Voice over IP (VoIP)
quality measurements to be taken on all Realtime Transport Protocol (RTP) voice
streams transmitted through an AOS device. The VQM statistics gathered by the
AOS device are shared with the n-Command
®
MSP server using the VQM
reporter. The reporter must be enabled on the AOS device before n-Command
MSP can aggregate the VQM statistics gathered by the AOS device. Configuring
the VQM reporter is done through the command line interface (CLI) on the AOS
device, and consists of creating the reporter, configuring the parameters of the
reporter, and viewing the reporter statistics. The reporter must be configured
before n-Command MSP will gather VQM statistics. VQM reporter configuration
instructions are outlined in the guide Configuring VQM Reporter for AOS and n-
Command MSP, available from ADTRAN's Support Forum at
http://supportforums.adtran.com.
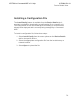
The VQM Statistics menu has two methods for viewing voice data. The first is a
line chart that displays mean opinion score listening quality (MOS LQ) averages,
individual voice streams, or a combination of the two. The second section is the
individual call detail grid. To switch from one view to another, select the
appropriate icon on the bottom left of the graph. Move the mouse over the icon to
display a tool tip describing the view option. The individual call detail grid section
is toggled on or off by selecting the last of the four view option icons.
More information is provided for interpreting VQM statistics in Configuring Voice
Quality Monitoring (VQM) in AOS, available from ADTRAN's Support Forum at:
http://supportforums.adtran.com.
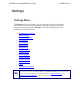
Line Graph
The line graph can display the averages of one interface or the average of all
interfaces on the device. Select or deselect the interfaces using the check boxes
to the left of the line graph. Not all of the listed interfaces will have voice data to
report.
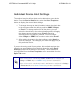
The refresh rate can be changed by selecting the Chart Options from the lower
left corner of the screen. The refresh rate only applies to the chart when you are
viewing the current day. Make a selection from the drop-down menu.
A 2-week interval is shown on the bottom graph. To zoom in on a smaller time
period and display it in detail on the top graph, click and drag the sliders to
include the time frame. The tool tips display a start and end time. The date can
be changed by selecting the pop-up menu from the lower right corner next to
Jump to Day. Select a date from the list to apply it to the line graph.
ADTRAN n-Command MSP v6.1 Help
61700841G1-1A