
User Manual


10
Test Points F and G
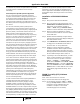
RF local oscillator (LO):
The behavior of the RF VCO can be monitored at Test Point F.
The VCO output should be locked at the channel frequency
minus the IF (374MHz.) This means that the VCO will have
to lock between 2038MHz and 2110MHz. The output power
at test point F is approximately -6dBm. Ideally, the tuning
voltage of the VCO, when locked, falls between 0.5V and
2.2V. The tuning voltage of the RF VCO can be observed at
Te st P o in t G.
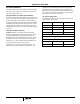
Test Points H and I
IF local oscillator (LO):
The IF VCO is a discrete design and operates at 748MHz
(i.e., twice the IF frequency). The output frequency of this
VCO does not need to be varied; thus, minimal tuning range
is required.
The output frequency of this VCO can be observed at Test
Point H.
Ideally, the tuning voltage of the IF VCO, when locked, falls
between 0.5V and 2.2V. The tuning voltage of the IF VCO
can be observed at Test Point I.
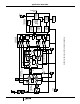
Test Point J
IF Receive Signal:
The intermediate frequency (IF) receive signal is the down-
converted receive signal prior to the SAW bandpass filter.
The center frequency of this signal is 374MHz with a
bandwidth of 17MHz. The power of this signal is directly
dependent on the input signal power.
Note that the spurious signal visible below the DS
spectrum’s frequency is a harmonic of the 44MHz clock.
Much of this level is due to stray pickup in the 500Ω RF
probe because of the relatively low signal level present. As
such, it will have no influence on receiver performance.
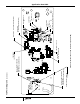
Test Point K-K1 and L-L1
Receive I and Q:
NOTE: BPSK mode is used for the plots in this figure; as such, I and
Qareinverseofeachother.
FIGURE 11. RF LOCAL OSCILLATOR OUTPUT AT CHANNEL 8
(TEST POINT F)
FIGURE 12. IF LOCAL OSCILLATOR OUTPUT (TEST POINT H)
FIGURE 13. IF RECEIVE SIGNAL PRIOR TO SAW FILTER
(TEST POINT J)
FIGURE 14. RECEIVE I AND Q SIGNALS (TEST POINTS K AND L)
Application Note 9949