
Technical data

Download, testing and diagnostics
CPU 317T: Technology Functions
A5E00251798-03
8-25
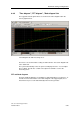
8.8.9 "Time diagram", "FFT diagram", "Bode diagram"tab
The logged measured signal values are shown in the "Time diagram" tab in the
form of graphic trends.
"Time Diagram" tab with measuring cursor
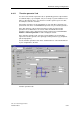
The traces to be shown and the scaling are defined in the "Trace time diagram" tab
of the detail view.
The system automatically scales the yaxis for all displayed curves. You can adjust
these settings. The tab also contains a description of auxiliaries such as the
measuring cursor.
FFT and Bode diagrams
The FFT and Bode diagrams are available for mathematically processed traces. To
view the Fourier transformation or the Bode diagram of the logged signals, these
must have been processed mathematically in the function generator.