
Technical data

Download, testing and diagnostics
CPU 317T: Technology Functions
A5E00251798-03
8-33
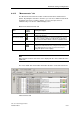
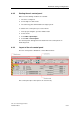
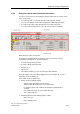
8.8.13 "Trace time diagram" tab in the detail view
Traces shown in the "Time Diagram" tab are configured in the "Trace time
diagram" tab.
"Trace time diagram" tab in the detail view
Set the "Show" check box to view the trace in the "Time Diagram" tab. Disable the
check box to hide the trace.
When a trace is shown, you can set the "Scale" check box. The scale for this trace
is then shown.
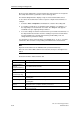
When the measuring cursors are shown, the system also indicates the function
values of the active trace Y(X1/2) at the measuring cursor positions X1/2, including
the relevant delta-Y and delta-X or delta-t differences.
Note
Open the shortcut menu for the individual rows/curves:
Place the cursor in the first column in front of the line, then press the right mouse
button.
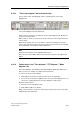
8.8.14 Further tools in the "Time diagram", "FFT diagram", "Bode
diagram" tab
The "Time diagram", "FFT diagram" and "Bode diagram" tab provide further tools
that you can use to analyze recorded measurement traces.
You can zoom an area of the display:
1. Mark with pressed left mouse button on the area to be expanded.
2. The zoom area selected is magnified to the size of the whole display area. You
can use the scrolling function to move the diagram to another view.
Open the shortcut menu:
3. Place the cursor in the display area.
4. Click with the right mouse button.
Many of these functions can also be called in the shortcut menu of the "Trace time
diagram" tab of the detail view.