
User's Manual


Automatic Line Routing: iGrafx FlowCharter 2003 features dynamic line management in
the form of automatic line routing. When you connect two shapes, iGrafx FlowCharter
automatically routes the connector line between them. If you modify the shapes in the
diagram, the Automatic Line Routing feature saves you considerable time by automatically
redrawing the connector lines between the shapes.
Unlimited page/diagram size: iGrafx FlowCharter 2003 imposes no limitation on page or
diagram size. The intuitive Page Setup dialog box gives you extensive options for specifying
page orientation, scaling, paper size, margins, headers and footers, and page order.
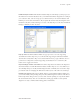
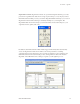
Tabular editing view: For convenience when editing long documents, iGrafx FlowCharter
2003 lets you choose between Normal and Tabular views. The Tabular view presents the
information in your diagram in a spreadsheet format. This feature is valuable when editing
and updating large, complex diagrams that contain a large amount of information.
Import filters: iGrafx FlowCharter 2003 includes more than 20 import filters, including
Computer Graphics Metafile (CGM), AutoCAD
®
(DWG), and Visio
®
. You can import and
re-purpose any documents created with Visio.
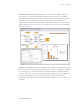
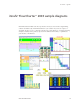
Build enterprise models
A process map only goes so far in describing how your business operates. The key to truly
visualize, understand, and improve your processes is modeling and simulation. By adding
information to a process map about how work gets done, you will be able to build a replica
of real-life processes. The replica, or process model, can then be experimented with for
testing proposed process improvements. This method of modeling and simulation can save
your organization considerable time and money during a process improvement initiative.
iGrafx FlowCharter 2003 includes many features that help make it easy for you to get a
head start on building process models.
Intelligent Departments (swim lanes): When you create a Process diagram type,
Departments, or swim lanes, appear in the diagram by default. When you place a shape
within a Department, the shape is anchored to that department. If you choose to reposition
the Department, the shape automatically moves with it. You can also add Departments to a
Basic diagram type.
Phase lines: When creating a Process diagram type, you can add Phase lines to indicate
relative time periods. For example, you may want to add three phases to a production
diagram ¾ pre-production, production, and post-production. The Phase lines provide a
visual break to illustrate various segments of a process flow. Phase lines may only be placed
in a Process diagram or a Basic diagram that has Departments.
iGrafx FlowCharter 2003 11
reviewer’s guide