
User's Manual


File : CS-SUP-MUTI-WTHERMSPETEC-E02.sxw
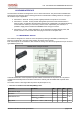
➢ Climate diagram
The climate diagram illustrated above represents the amount of time spent by the module at a given
temperature. It is used for calculation of the module operating life.
1.3.2 ESTIMATION OF OPERATING LIFE
The initial parameters are the radio polling frequency, population of modules in the area and the datalogging
mode parameter settings.
The population of modules corresponds to the number of modules within range of one another. Each module
monitors all frames even those not directed at it which consequently has an impact on power consumption.
The following estimations are based on the assumption that all modules are read at the same polling
frequency.
The theoretic operating life calculation taking into account the various parameters is relatively complex.
In this document we have therefore chosen various graphs illustrating the influence of these parameters on
the product operating life.
➢ Operating life = f (Nb of radio pollings)
The datalogging period is set at 15 minutes
The standard peer-to-peer read mode is used
The blue line corresponds to a module population of 3
The red line corresponds to a module population of 50.
WaveTherm module technical specifications page 10 of 31
Outdoor
Duration
(%)
-20 -10 0 20 40 50 60
5 %
10 %
15 %
20 %
25 %
30 %
Temperature (°C)
6 12 18 24
30 36 42
48
10
5
Nb of pollings per
day
Operating life (in years)
Population : 3 modules
Peer-to-peer mode
Population : 50 modules
Peer-to-peer mode