Instruction Manual
Manuals
Brands
Crane Song Manuals
Audio
IBIS
1
2
3
4
5
6
7
8
9
10
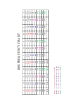
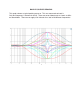
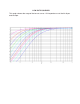
LOW CUT EQ CURVES
This graph showes a typical low cut curve. Three frequencies are showen for clarity
. Each
showing the 12 db pre octave slope and the 24 db per octave slope. Frequencies of 40 ,
80, and 150 Hz are showen.
1
...
...
6
7
8
9
10
11
...
12