
Installation Manual


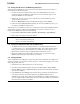
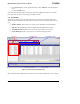
Table Of Contents
- About This Document
- 1 Introduction
- 2 Quick Start for the OEM Kit Users
- 3 Product Overview
- 4 IRIS OEM Reference Board
- 5 Power
- 6 Radios
- 7 Antennas
- 8 Flash Data Logger and Serial ID Chip
- 9 Atmega1281 Fuses
- 10 Sensor Boards & Expansion Connectors
- 11 USB Programming Pod
- 12 Appendix A. Warranty and Support Information

IRIS OEM Edition Hardware Reference Manual
5. In the Sensor Board tab, for the Application Name, select “XMDA300” from the pull-down
menu.
6. Click on the DONE button.
Soon after that it should display incoming data. Click on the MoteView window to view data,
time plots of sensor values, and topology of the Mote network.
2.1.5 User Interfaces
You should see nodes one, two and three appear in the node list on the left hand side of the
MoteView window. MoteView has four main user interface sections which you can browse and
use.
• Toolbar / Menus: Allows the user to specify actions and initiate command dialogs.
• Node List: Shows all known nodes in a deployment and health status summary.
• Visualization Tabs: Enables the user to view the sensor data in various ways.
• Server Messages: Displays a log of server events and incoming messages.
Server Messages
Toolbar/Menus Visualization Tabs Node List
Figure 2-1. Screenshot of the MoteView GUI
More information about MoteView and its features can be found in the MoteView User’s manual.
Doc. # 7430-0549-01 Rev. B Page 7