
Specifications
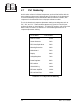

3–5
Operation
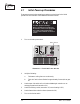
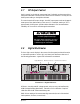
3.3 Front Panel Bar-Dot Displays
Bar-dot LEDs show audio input levels, wideband and highband audio gain control, and
modulation percentage. Resolution for the gain control and modulation displays is
increased over a conventional bar-graph display using dither enhancement which
modulates the brightness of the LED to give the effect of a fade from dot to dot. (See
section 4.7.)
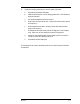
3.3.1 Audio Processor Input
Two vertical, moving-dot displays for the left and right channels indicate the relative
audio levels, in 3 dB steps, at the input of the audio processor. Under normal operat-
ing conditions, the left and right Audio Processor indicators will be active, indicating
the relative audio input level after the Input Gain switches. During program pauses,
the red Low LED will light.
With the receiver module option installed, the audio processor indicators are disabled.
3.3.2 Highband and Wideband Display
During audio processing, the moving-dot displays indicate the amount of gain control
for broadband (Wide) and pre-emphasized (High) audio. These indicators are disabled
if the receiver module option is installed.
As long as program material causes activity of the Wideband green indicators, deter-
mined by the program source level and Input Gain switches, the transmitter will be
fully modulated. (See section 3.4.)
The Wideband indicator shows short-term “syllabic-rate” expansion and gain reduction
around a long-term (several seconds) average gain set.
Program material and the setting of the Processing control determine the magnitude
of the short-term expansion and compression (the rapid left and right movement of the
green light).
High-frequency program content affects the activity of the Highband indicator. With
75–µsec pre-emphasis, Highband processing begins at about 2 kHz and increases as the
audio frequency increases. Some programs, especially speech, may show no activity
while some music programs may show a great deal of activity.
3.3.3 Modulation Display
A 10–segment, vertical peak-and-hold, bar graph displays the peak modulation percent-
age. A reading of “100” coincides with 75 kHz deviation. The display holds briefly
(about 0.1 seconds) after the peak. The “Pilot” indicator illuminates when the trans-
mitter is in the stereo mode.
To verify the actual (or more precise) modulation percentage, connect a certified
modulation monitor to the RF monitor jack on the rear panel.