
Instruction manual


www.cs-instruments.com
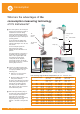
Step 3:
Evaluation at the PC with
graphics and statistics
3.2 Graphic evaluation with day view
and week view
Everything at a glance: The user gets a
day and a week view of all stored
measured data with his company logo
(can be easily integrated) at the touch
of a button.
By means of the zoom and the crosslines
function peak values can be determined.
3.3 Compressed air costs in €
At the touch of a button the user gets all
important data like e. g.
Energy costs,
Compressed air costs,
Leakage costs in €,
Compressor data with load/
idle times
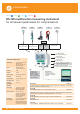
3.1 Entry of necessary parameters
Specific data have to be entered before
the analysis is carried out:
Selection of compressor type
(load/idle resp. variable speed drive
controlled)
as well as entry of the performance
data according to data sheet
Period of measurement
Costs in € for 1kWh
32
Consumption