
Specifications

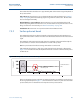

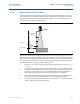
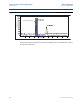
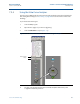
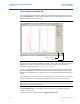
Table Of Contents
- Rosemount 5400 Series
- Section 1: Introduction
- Section 2: Transmitter Overview
- Section 3: Mechanical Installation
- 3.3.1 Mounting location 22
- 3.3.2 Special considerations in solids applications 24
- 3.3.3 Mounting in pipes 25
- 3.3.4 Installation considerations 26
- 3.3.5 Nozzle considerations 27
- 3.3.6 Nozzle recommendations and requirements 30
- 3.3.7 Service space 32
- 3.3.8 Beamwidth 33
- 3.3.9 Vessel characteristics 35
- 3.3.10 Disturbing objects 35
- 3.3.11 Valves 35
- 3.4.1 Cone antenna flange connection 36
- 3.4.2 Process seal antenna 37
- 3.4.3 Rod antenna threaded connection 38
- 3.4.4 Rod antenna flanged connection 39
- 3.4.5 Tri-Clamp™ tank connection 40
- 3.4.6 Bracket mounting on wall 41
- 3.4.7 Bracket mounting on pipe 42
- Section 4: Electrical Installation
- 4.3.1 Conduit electrical connector wiring (using minifast®) 45
- 4.7.1 Connecting the transmitter 47
- 4.8.1 Power requirements 49
- 4.8.2 Load limitations 49
- 4.8.3 Non-intrinsically safe power supply 51
- 4.8.4 Intrinsically safe power supply 52
- 4.8.5 Type N approvals: non-sparking / energy-limited power supply 53
- 4.8.6 Transient protection terminal block 54
- 4.9.1 Power requirements 55
- 4.9.2 Non-intrinsically safe power supply 57
- 4.9.3 Intrinsically safe power supply 58
- 4.9.4 Type N approvals: non-sparking / energy-limited power supply 59
- 4.10.1 Connecting the transmitter 60
- 4.10.2 Connection terminals 62
- 4.10.3 RS-485 bus 63
- 4.10.4 Installation cases 63
- 4.10.5 External HART devices (slaves) 65
- 4.11.1 Connect to the MA/MB terminals 66
- 4.11.2 Connect to the HART terminals 68
- 4.12.1 Tri-Loop™ HART to analog converter 69
- 4.12.2 751 Field Signal Indicator 70
- 4.12.3 Smart Wireless THUM™ Adapter 71
- Section 5: Basic Configuration/Start-up
- 5.2.1 Basic configuration parameters 74
- 5.2.2 Configuration tools 74
- 5.3.1 Measurement units 75
- 5.3.2 Tank geometry 75
- 5.3.3 Process conditions 77
- 5.3.4 Volume configuration 78
- 5.3.5 Analog output (HART) 81
- 5.3.6 Level and distance calibration 82
- 5.3.7 Echo tuning 83
- 5.3.8 ATC 84
- 5.4.1 System requirements 84
- 5.4.2 Help in RRM 85
- 5.4.3 Installing the RRM software for HART communication 85
- 5.4.4 Specifying the COM port 87
- 5.4.5 To set the COM port buffers 88
- 5.4.6 Specifying measurement units 88
- 5.4.7 Installing the RRM software for Foundation fieldbus 88
- 5.4.8 Specifying measurement units 90
- 5.4.9 Using the Setup functions 91
- 5.4.10 Guided setup 92
- 5.4.11 Using the Setup functions 100
- 5.8.1 Advanced configuration 111
- 5.9.1 Assigning device tag and node address 113
- 5.9.2 Foundation fieldbus block operation 113
- 5.10.1 Radar level transmitter - level value 115
- 5.10.2 Radar level transmitter - level value in percent (%) 116
- Section 6: Operation
- Section 7: Service and Troubleshooting
- 7.3.1 Analyzing the measurement signal 132
- 7.3.2 Surface pulse not found 133
- 7.3.3 Registration of false echoes 135
- 7.3.4 Using the Echo Curve Analyzer 137
- 7.3.5 Using the Echo Curve Analyzer with a Field Communicator 140
- 7.14.1 Troubleshooting 153
- 7.14.2 Device status 153
- 7.14.3 Errors 154
- 7.14.4 Warnings 155
- 7.14.5 Measurement status 155
- 7.14.6 Volume calculation status 157
- 7.14.7 Analog Output status 158
- 7.14.8 Application errors 159
- 7.15.1 Resource block 164
- 7.15.2 Transducer block 165
- 7.15.3 Analog Input (AI) function block 165
- Section 8: Safety Instrumented Systems (4-20 mA Only)
- 8.2.1 Applicable models 168
- 8.2.2 Skill level of personnel 169
- 8.5.1 Damping 171
- 8.5.2 Alarm and saturation levels 171
- 8.5.3 Amplitude threshold 172
- 8.5.4 Write protection 172
- 8.5.5 Site acceptance 172
- 8.6.1 General 172
- 8.6.2 Inspection 173
- 8.7.1 Specifications 174
- 8.7.2 Failure rate data 174
- 8.7.3 Useful lifetime 174
- A.1.1 General 177
- A.1.2 4-20 mA HART® (output option code H) 178
- A.1.3 Foundation™ fieldbus (output option code F) 181
- A.1.4 RS-485 with Modbus communication (output option code M) 183
- A.1.5 Display and configuration 185
- A.1.6 Diagnostics 186
- A.1.7 Temperature and pressure limits 187
- A.2.1 General 189
- A.2.2 Measuring range 190
- A.2.3 Beam angle and beam width 191
- A.2.4 Transition zone and near zone 193
- A.2.5 Environment 194
- A.3.1 Material selection 195
- A.3.2 Housing and closure 195
- A.3.3 Engineered solutions 196
- A.3.4 Tank connection and antennas 196
- A.4.1 Rosemount 5402 and 5401 with SST Cone Antenna (Model Code: 2S-8S) 200
- A.4.2 Rosemount 5402 and 5401 with Protective Plate Cone Antenna (Model Code: 2H-8H, 2M-8M, and 2N-8N) 201
- A.4.3 Rosemount 5401 with Rod Antenna (Model Code: 1R-4R) 202
- A.4.4 Rosemount 5402 with Process Seal Antenna (Model Code: 2P-4P) 203
- A.4.5 Bracket mounting (Model Code: BR) 204
- A.4.6 Process connections 205
- B.5.1 North-American certifications 220
- B.5.2 Canadian Standards Association (CSA) Approvals 221
- B.5.3 European certifications 222
- B.5.4 IECEx Approval 224
- B.5.5 EAC certifications 225
- B.5.6 Brazilian certifications 226
- B.5.7 Chinese certifications 226
- B.5.8 Japanese certifications 227
- B.5.9 Other certifications 228
- B.5.10 Canadian Registration Number (CRN) 229
- C.1.1 Distance offset (G) 237
- C.1.2 Minimum level offset (C) 238
- C.1.3 Hold off distance 238
- C.1.4 Calibration distance 238
- C.3.1 Antenna type 239
- C.3.2 Empty tank handling 239
- C.3.3 Full tank handling 241
- C.3.4 Double bounce 241
- C.3.5 Surface echo tracking 242
- C.3.6 Filter settings 243
- C.4.1 Empty tank handling 243
- C.4.2 Full tank handling 247
- C.4.3 Double bounce 248
- C.4.4 Surface echo tracking 249
- C.4.5 Hold off setting 250
- E.1.1 Definition 257
- E.1.2 Channel definitions 257
- E.3.1 Unit codes 263
- F.1.1 Register access transducer block parameters 265
- G.1.1 Advanced configuration transducer block parameters 269
- H.2.1 PlantWeb® alerts 278
- H.2.2 Alarm priority 281
- H.2.3 Recommended actions for PlantWeb alerts 282
- I.6.1 Status handling 292
- Section 1 Introduction
- Section 2 Transmitter Overview
- Section 3 Mechanical Installation
- Section 4 Electrical Installation
- Section 5 Basic Configuration/Start-up
- 5.1 Safety messages
- 5.2 Overview
- 5.3 Basic configuration parameters
- 5.4 Basic configuration using RRM
- 5.5 Configuration using a Field Communicator
- 5.7 Basic configuration using AMS Suite
- 5.8 Configuration using DeltaV
- 5.9 Foundation fieldbus overview
- 5.10 Application examples
- 5.11 Tri-Loop™ HART to Analog Converter
- 5.12 HART multidrop configuration
- Section 6 Operation
- Section 7 Service and Troubleshooting
- 7.1 Safety messages
- 7.2 Troubleshooting overview
- 7.3 Service overview
- 7.4 Analog Output calibration
- 7.5 Logging measurement data
- 7.6 Backing up the transmitter configuration
- 7.7 Diagnostics
- 7.8 Configuration report
- 7.9 Viewing input and holding registers
- 7.10 Reset to factory settings
- 7.11 Surface search
- 7.12 Using the Simulation Mode
- 7.13 Write protecting a transmitter
- 7.14 Diagnostic messages
- 7.15 Troubleshooting
- Section 8 Safety Instrumented Systems (4-20 mA Only)
- Appendix A Reference Data
- Appendix B Product Certifications
- Appendix C Advanced Configuration
- Appendix D Performing Proof Test
- Appendix E Level Transducer Block
- Appendix F Register Transducer Block
- Appendix G Advanced Configuration Transducer Block
- Appendix H Resource Block
- Appendix I Analog-Input Block
137
Reference Manual
00809-0100-4026, Rev HA
Section 7: Service and Troubleshooting
November 2014
Service and Troubleshooting
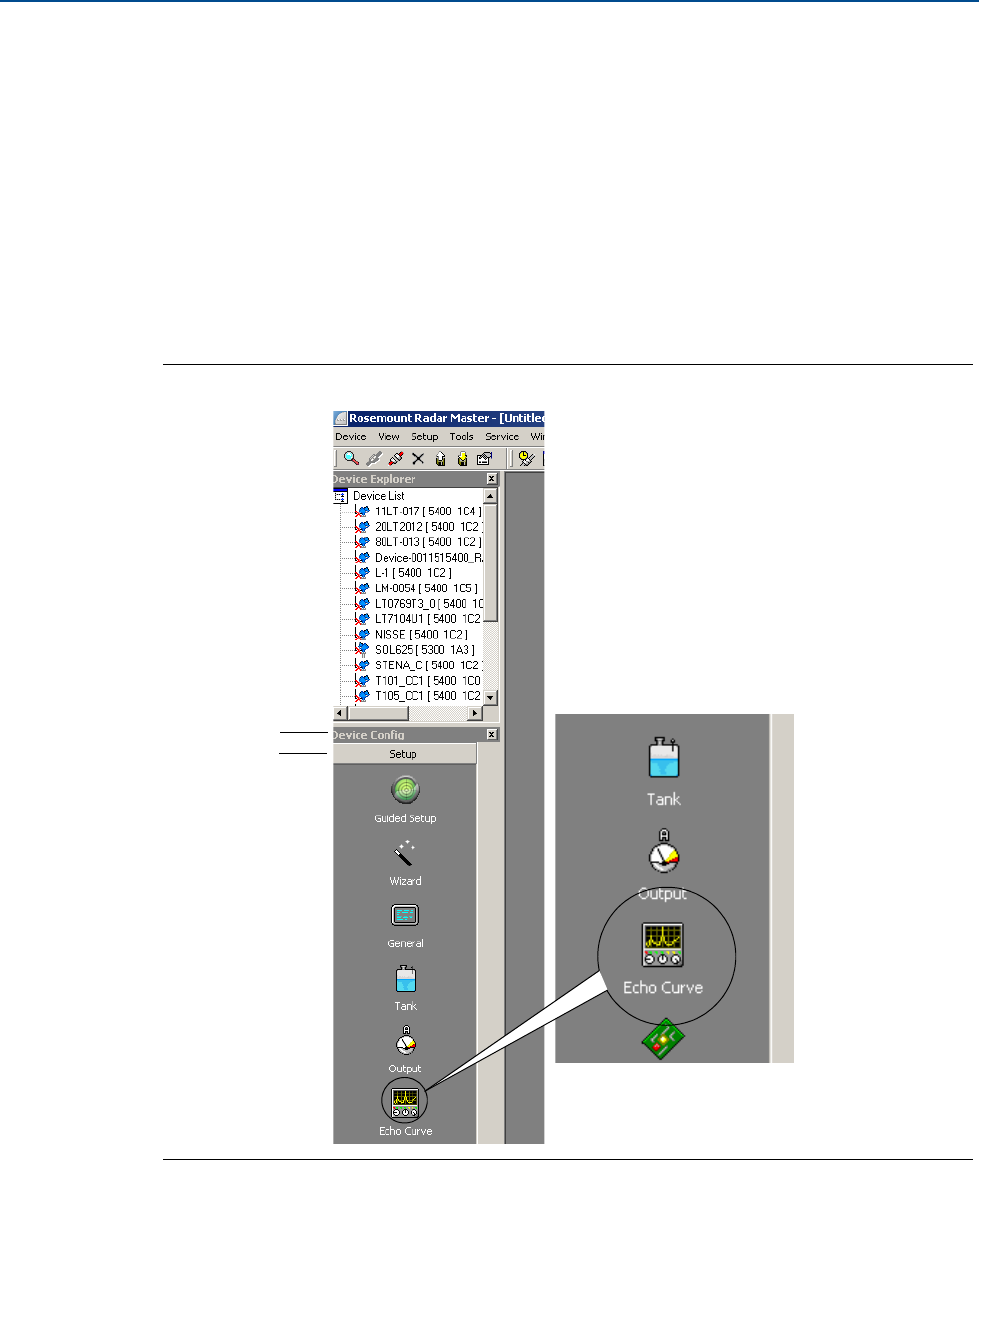
7.3.4 Using the Echo Curve Analyzer
The Echo Curve in RRM shows the measurement signal amplitude in the tank and includes the
Echo Tuning functionality (see “Echo tuning” on page 83 for more information on false echo
handling).
To plot the measurement signal:
1. Start the RRM program.
2. Open Device Config/Tools (or Device Config/Setup).
3. Click the Echo Curve icon (see Figure 7-7).
Figure 7-7. The Echo Curve Function is a Useful Tool for Signal Analysis
4. The Echo Curve Analyzer window appears with the View/Record Mode tab (or the
Configuration Mode tab) selected.
Device Config
Setup