
Specifications

21-0402E v1.1.3 SiteWatch™ User and Technical Guide 11
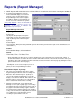
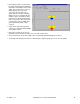
• Each Station’s Name, the date it was
First Run and its Oldest Recording are
listed inside red and blue circles on the
graph. These items can be selected
under “Display” at the top of the
screen. A red circle represents a
station that has common recordings
with the last one occurring inside the
number of days selected in the Time
Horizon box on the Report Manager’s
main screen. A blue circle represents
a station whose last recordings have
gone beyond the number of days
selected.
• 4 way arrows at the top left provide
controls for zooming up/down/left/right
on the station circles.
• Next to these arrows are 2 more for
maximum zoom, horizontal or vertical, in or out on the station circles.
• There are four more arrows to the right of these for panning up/down/left/right on the circles.
• To the right of the Display selections is a “Print” button to print the graph or an “X” to close the graph.