
User`s guide


30 Cray T3E User’s Guide
+ APP 0xdd 2 192 0 1 2 0 0 7 375 118 118
+ APP 0xde 2 192 0 1 2 1 0 7 375 118 118
+ APP 0xdf 2 192 0 1 2 0 1 7 375 118 118
+ OS 0xe0 0 0 0 0 0 1 1 7 375 92 40
+ CMD 0xe1 1 1 0 unlim unlim 0 2 7 375 115 42
+ CMD 0xe2 1 1 0 unlim unlim 1 2 7 375 115 92
+ CMD 0xe3 1 1 0 unlim unlim 0 3 7 375 116 87
+ CMD 0xe4 1 1 0 unlim unlim 1 3 7 375 116 97
+ CMD 0xe5 1 1 0 unlim unlim 2 0 7 375 116 100
- NUL 0xe6 0 0 0 0 0 0 3 6 0 0 0
- NUL 0xe7 0 0 0 0 0 1 2 6 0 0 0
+ CMD 0xe8 1 1 0 unlim unlim 3 0 7 375 117 100
+ CMD 0xe9 1 1 0 unlim unlim 2 1 7 375 117 99
+ CMD 0xea 1 1 0 unlim unlim 3 1 7 375 117 100
+ CMD 0xeb 1 1 0 unlim unlim 2 2 7 375 117 113
+ CMD 0xec 1 1 0 unlim unlim 3 2 7 375 117 99
+ CMD 0xed 1 1 0 unlim unlim 2 3 7 375 116 99
+ CMD 0xee 1 1 0 unlim unlim 3 3 7 375 116 113
+ OS 0xef 0 0 0 0 0 0 0 3 375 105 105
Exec Queue: 4 entries total. 4 running, 0 queued
uid gid acid Label Size BasePE ApId Command Note
nnnn nnnn nnnn - 16 0x68 11839 ./prog1 -
nnnn nnnn nnnn - 64 0 16931 ./prog2 -
nnnn nnnn nnnn - 16 0x40 36477 ./prog3 -
nnnn nnnn nnnn - 64 0x78 38718 ./prog4 -
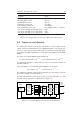
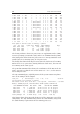
The listing indicates that 224 processors are application nodes (APP),
two are operating system nodes (OS), and 12 are command nodes (CMD).
This listing also shows that two processors were non-operational. Four
parallel jobs were running using 16–64 processors.
The listing also shows that all processors have the clock rate of 375 MHz.
Earlier there were processors having different clock rates, but now all
are running at the same speed.
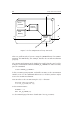
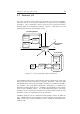
The grmview command also shows the coordinates of the PEs in the 3D
torus. You can see that the size of the torus is 8 × 4 × 7, so the torus is
not a complete cube.
The top command gives a global picture of the system status at a glance.
Here is an example of the output:
last pid: 5; load averages: 0.00, 0.00, 0.00 09:37:10
116 processes: 110 sleeping, 6 running
CPU states: 31.9% idle, 66.7% user, 0.0% syscall, 1.4% kernel, 0.0% wait
Memory: 30464M physical, 28025M usrmem, 2428M sysmem, 16447M free
PID USERNAME PRI NICE RES STATE TIME CPU NPE @PE COMMAND
1406 user1 24 0 653M run 79.9H 100.0% 32 64 prog1.x
1688 user1 -5 0 1861M run 69.7H 100.0% 32 96 prog2.x
9985 user2 -5 0 4582M run 24.3H 99.6% 64 128 prog3.x
9864 user3 34 0 245M run 391:11 97.3% 16 20 prog4.x
8817 user4 -5 0 1062M run 707:08 94.9% 16 0 prog5.x
10501 jhaataja 34 4 7120K sleep 0:04 25.5% 1 195 top
This listing shows that currently about 67% of the computer is used for
computing. The top command also shows the total memory usage and
the total memory requirements of the running processes.