
User`s guide


92 Cray T3E User’s Guide
level position the cursor on the box and press the left mouse button. To
close the tree one level position the cursor on the node name and press
the right mouse button. When you click on a node, that node becomes
the current node and is displayed in the main Xbrowse window.
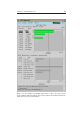
The command Caller/Call Tree displays a static call tree of routines
that call a specified subprogram and, in turn, displays any subprograms
called by the specified subprogram. Selecting a node on the tree high-
lights the subprogram. The name of the source file (or the application
when in application mode) used by this option is shown at the top of the
window. Calling sequences are displayed in the middle of the window.
You find more information on the Program Browser with the command
man xbrowse, from the help system of the Program Browser itself, or
from the manual Introducing the Program Browser [Crag], available on-
line at http://www.csc.fi:8080.
9.3 Debugging programs
9.3.1 Cray TotalView parallel debugger
The Cray TotalView is a symbolic debugger for parallel (or non-parallel)
programs written in Fortran, C, C++ or HPF. The principal difference
between conventional Unix debuggers and TotalView is that TotalView
can debug multiple processes of parallel programs simultaneously and
synchronously.
The Cray TotalView is available in both X Window System and line-mode
versions. To use the Cray TotalView debugger, compile and link pro-
grams with the option -g. The option -G in Fortran, C and C++ compilers
may also be used.
You may inspect either a malleable or non-malleable code by TotalView.
The following example illustrates usage of TotalView with a fixed num-
ber of 16 processors:
t3e% f90 -X16 -g -o prog.x prog.f90
t3e% totalview ./prog.x &
When debugging a malleable code, use the TotalView option -X, e.g.,
t3e% totalview -X 16 ./prog.x &
The space before the number of processors is mandatory.
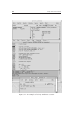
The TotalView graphical interface shows the program code, the call se-
quence, local variables and TotalView messages. Program execution can
be controlled by pressing execution buttons or by typing in commands.
The currently active section of source code is always displayed. When
a subroutine is called, the debugger opens corresponding source files.