
User guide


AudioCore Version 8.40
AudioCore Version 8.40AudioCore Version 8.40
AudioCore Version 8.40
Page 29
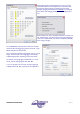
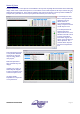
Shadow EQ Curves
A further enhancement to the response curves available on the input and output EQ tabs is the addition of the shadow EQ
display. When a filter is selected for adjustment, its contribution to the overall response for that output is shown as a grey
shadow fill on the background. This is useful for indicating when a band’s contribution to the output will be inaudible, for
example when a parametric is set to a frequency above the crossover point on that output.
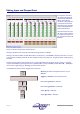
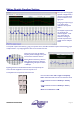
In this example, the notch
filter on this input has been
selected and the grey
shadow shows its
symmetrical bandwidth
clearly, compared to the red
overall response curve.
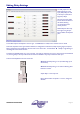
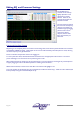
In the example below the
selected parametric’s
response can be seen, and it
should be noted that a lot of
its power is outside the
actual useful range for that
output, due to the setting of
the low pass filter. The
crossover filters responses
are shown as separate blue
lines.
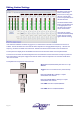
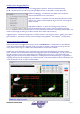
Note that selecting the high
or low pass filter will show
the frequency range that
they are cutting, as this is
their purpose.
Phase and all pass filters
have no shadow EQ curve
displays.
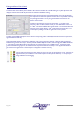
If a filter is set to “Flat”, its
shadow EQ will disappear,
as will its contribution to the
overall red response curve.
Its node is still fully
adjustable and it may be set
to new parameters.