
User guide


Page 50 AudioCore Version 8.40
AudioCore Version 8.40AudioCore Version 8.40
AudioCore Version 8.40
Printing from AudioCore
AudioCoreAudioCore
AudioCore
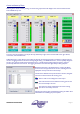
AudioCore can produce a tabular and graphical printout of any part of your system.
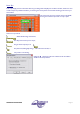
This is set up via File Print… from the menu, or with the shortcut button on the toolbar. Either will display the
options window shown here.
The options available allow the unit (or all units) to be chosen for printing and whether to print all the uploaded memory
settings. The information shown in the graphical representations may be adapted as follows:
No Curves - only tabular data is printed
Individual Curves - Each output will generate a separate graph showing just the
crossover filters’ frequency response.
Combined Xover Curve - One graph is drawn for output crossover filters, with
colour coding for each output, like the “Global View” on the editing screens.
Combined Xover Curves & Output EQ - One graph is drawn for output
crossover filters including the effect of the output EQ on each channel, with
colour coding for each output.
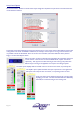
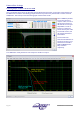
A typical printout for the “Individual Curves” option might look like this:
The tabular format is shown on the left and the eight response curves (individual outputs on a DP448) is on the right. If
you only require information on the current (i.e. audible) configurations of the system, make sure the ‘Include Memories’
check box in the options is NOT checked. Otherwise, six pages of information will be printed for every memory of
every unit, which might accumulate to many pages.
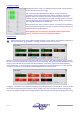
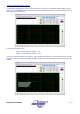
The “Highlight Used Filters” option prints all filter settings that are active on the tabular layout in red so it can be easily
seen which bands of EQ are being used.