
User`s manual

405-00026-00iNspect Express User’s Manual
96 Rev 1600; 12 July 2010
Graphing Measurements
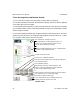
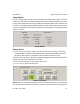
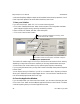
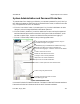
You can click on the check boxes at the right side of the Edit Tolerances window, to display a
graph or plot of a measurements values over time. You can display more than one plot. Right-
click inside a plot window to zoom, or pan/scroll in the plot.
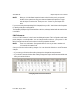
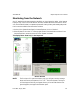
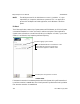
Plot – plot in standard time. Older measurements scroll off the left side of the plot window. This
is the “Plot” option in Edit Tolerances.
Trend – Older measurements do not scroll off the window. The time axis is compressed over
longer time, so the trend of the entire run time is displayed. The display shows less resolution
over time, but trends are more discernable.
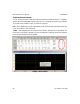
Plotting a Measurement