
User`s guide


12
12
13
13
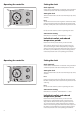
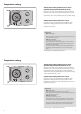
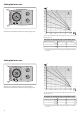
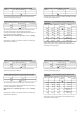
The heat curve shows the relation between the outdoor
tem per a ture and the fl ow temperature of the heating circuit.
Setting the heat curve
1
8
1
2
6
1
8
1
2
6
1
8
1
2
6
1
8
1
2
6
1
8
1
2
6
1
8
1
2
6
12
3
6
9
-20 -10 0 10 20-30
10
20
30
40
50
60
70
80
90
1.8
1.2
0.6
0.2
2.2
˚C
˚C
You can set the heating curve slope in the range from 0.2 to 2.2. The slope
is factory set to 1.2.
*) Dimensioning temperature depending on the temperature normal for
your area.
Examples of setting the slope of the heat curve
Outdoor temperature*
Radiator circuit
Floor heating
-25 ºC
1.2
0.5
-15 ºC
1.6
0.6
-10 ºC
1.8
0.7
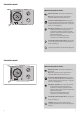
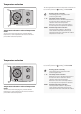
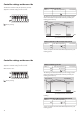