
Programming instructions

Chapter 7 Buffering Your Way through Waveform Acquisition
LabVIEW Data Acquisition Basics Manual 7-14
©
National Instruments Corporation
daq\anlogin\anlogin.llb
and the rest of the example VIs in
labview\examples\daq\anlogin\strmdsk.llb
. For information on
how these examples work and how to modify them, open
Windows»Show
VI Information
or open the
Help
window by choosing
Help»Show Help
.
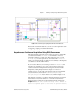
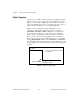
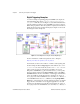
Cont Acq&Chart (buffered).vi
The
Cont Acq&Chart (buffered).vi
demonstrates circular-buffered
analog input similarly to the previous example, but this VI includes other
front panel inputs.
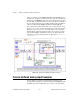
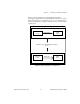
Cont Acq&Graph (buffered).vi
The
Cont Acq & Graph (buffered).vi
is similar to the
Cont Acq&Chart (buffered).vi
, except this VI displays data in a
waveform graph.
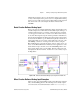
Cont Acq to File (binary).vi
In the
Cont Acq to File (binary).vi
, your program acquires data
through circular-buffered analog input and stores it in a specified file as
binary data. This process is more commonly called
streaming to disk
.
Cont Acq to File (scaled).vi
The
Cont Acq to File (scaled).vi
is similar to the previous binary
VI, with the exception that this VI writes the acquired data to a file as scaled
voltage readings rather than binary values.
Cont Acq to Spreadsheet File.vi
The
Cont Acq to Spreadsheet File.vi
continuously reads data that
LabVIEW acquires in the circular buffer, and stores this data to a specified
file in spreadsheet format. You can view the data stored in a spreadsheet
file by this VI in any spreadsheet application.
Simultaneous Buffered Waveform Acquisition
and Waveform Generation
You might discover that along with your analog input acquisition, you also
would like to output analog data. If so, see Chapter 14,
Simultaneous
Buffered Waveform Acquisition and Generation
.