
Programming instructions

Chapter 29 Debugging Techniques
LabVIEW Data Acquisition Basics Manual 29-4
©
National Instruments Corporation
Execution Highlighting
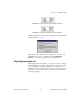
Execution highlighting (the light bulb button on the diagram) shows you
how data passes from one node to another in your program. When you turn
execution highlighting on, data movement is marked by bubbles moving
along the wires. Refer to Chapter 2,
Creating VIs
, in the
LabVIEW User
Manual,
and Chapter 4,
Executing and Debugging VIs and SubVIs
, in the
G Programming Reference Manual
for more information about execution
highlighting.
Using the Probe Tool
If your VI is producing questionable results, you may want to use the Probe
tool to check intermediate values in a VI. The Probe tool will help you
narrow down where the incorrect results are occurring. Refer to Chapter 2,
Creating VIs
, in the
LabVIEW User Manual
and Chapter 4,
Executing and
Debugging VIs and SubVIs
, in the
G Programming Reference Manual
for
more information on using the probe.
Setting Breakpoints and Showing Advanced DAQ VIs
Once you have narrowed down the location of an error to a subVI,
you can set a breakpoint on that subVI to cause VI execution to pause
before executing the subVI. You can now see what values get passed
in or are generated by the Advanced VIs, single-step through the subVI’s
execution, probe wires to see data, or change values of front panel
controls. Refer to Chapter 2,
Creating VIs
, in the
LabVIEW User Manual
and Chapter 4,
Executing and Debugging VIs and SubVIs
, in the
G Programming Reference Manual
for more information on how to set a
breakpoint.