
Programming instructions


Chapter 7 Buffering Your Way through Waveform Acquisition
LabVIEW Data Acquisition Basics Manual 7-6
©
National Instruments Corporation
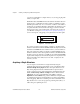
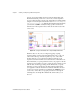
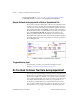
Figure 7-5.
Simple Buffered Analog Input Example
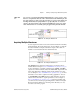
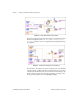
If you want to display the data on the same graph, look again at the Acquire
N Scans example VI, found in
labview\examples\daq\anlogin\
anlogin.llb
. Figure 7-6 shows a simple buffered input application that
uses graphing.
Figure 7-6.
Simple Buffered Analog Input with Graphing
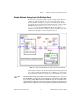
For a 2D array to be displayed on a waveform graph, each row of data must
represent a single plot. This is because waveform graphs are in row-major
order. Because the channel data is in each column, you must transpose the
2D array. Transposing the array can be done easily by popping-up on the
front panel of the graph and choosing
Transpose Array
.