IQ3 Data Logger Dash Installation Manual Disclaimer Competition Systems, Inc/Racepak make no representations or warranties of any type with respect to the contents in this manual. Competition Systems, Inc/Racepak disclaim any implied warranties or fitness for any particular purpose. Competition Systems, Inc/Racepak is not liable for any errors contained within or for incidental or consequential damages in connection with the supply, performance or use of the hardware and software or this manual.
IQ3 Data Logger Dash Installation Manual 2
IQ3 Data Logger Dash Installation Manual Disclaimer...........................................................................................................1 Warranty............................................................................................................1 Manual Summary................................................................................................6 Items Included With the IQ3 Data Logger Dash PN 250-DS-IQ3LD ............................................................
IQ3 Data Logger Dash Installation Manual Programming Modes ................................................................................................................................................................23 Setup Mode 1 (stationary programming) .............................................................................................................................24 Setup Mode 2 (moving programming) .........................................................................................
IQ3 Data Logger Dash Installation Manual Opening a Lap and Graphing Data: Road Racing/Circle Track/ Boats ...................66 Open a Lap..................................................................................................................................................................................66 Distance Mode Graphed Data .................................................................................................................................................
IQ3 Data Logger Dash Installation Manual Manual Summary This manual makes the assumption that you have installed the most current version of the DataLink PC software and IQ3 firmware. IQ3 firmware and DataLink updates can be found at http://www.racepak.com/IQ3Dash/downloads.htm. As of this writing, the most current DataLink version is 3.1.0. To compliment the overall simplicity of the IQ3 Data Logger Dash, we have created a User Manual that is equally simple in usage.
IQ3 Data Logger Dash Installation Manual IQ3 Features The IQ3 Logger Dash is a full programmable LCD digital display dash that is equipped with a 32 channel data logger, 3 axis G meter, 512MB microSD card and GPS board all contained inside the dash housing. This design eliminates the necessity of an external data logger, G meters or external GPS module.
IQ3 Data Logger Dash Installation Manual External Sensors The IQ3 Logger Dash utilizes Racepak’s Vnet (canbus) sensor input. This design provides the ability to transmit all sensor data through a single cable. This cable is connected to the 5 pin Vnet port on the rear of the dash. No sensor wiring harness is required. To add sensors, the customer simply measures from the IQ3 dash to the mounting location of the sensor or sensors, and orders the appropriate length pre-terminated Vnet extension cable.
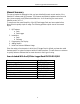
IQ3 Data Logger Dash Installation Manual Multiple Motorsports Usage Road Racing / Circle Track Features Track Mapping with Segments Lap Time and Lap Number Predictive Lap Time Accel G Lateral G Battery Voltage Engine RPM GPS Speed When utilized in closed course racing (circle track, road racing, boating) the data logger obtains GPS data to provide speed and lap time information to the driver.
IQ3 Data Logger Dash Installation Manual Technical Specifications Total Sensor Channels - Defined Below 38 Vnet Data Channels Internal Channels as defined below IQ3 Internal Temperature/IQ3 Logger Voltage / Engine RPM / Accel G / Lateral G / Vertical G / GPS 32 7 Accelerometer Specifications Sample Rate Accuracy Minimum / Maximum Values 100HZ - 3 Axis 1% (excluding vibration affect) +5 / -5 GPS Information GPS logging rate Channels Antenna Accuracy Cold start / Hot start satellite sync time 4 Hz wit
IQ3 Data Logger Dash Installation Manual IQ3 Logger Dash Functions The IQ3 Logger Dash is the main component of the data system, as it contains the data logger, 512MB memory card, GPS board and G meters. IQ3 Logger Dash Configuration File The Configuration File contains the programming settings for both the dash and any internal and external sensors utilized by the IQ3 Logger Dash. Any additional sensors that were not shipped with the IQ3 Logger Dash will require updating the Configuration file.
IQ3 Data Logger Dash Installation Manual Terminology In order to assist in the installation and usage of the IQ3, the following provides an outline of the most commonly used words that will be encountered in this manual. Analog: Data created by the reading of a voltage change sent from a sensor Calibrate: The process of assigning values to sensor voltage output, in order to graph and analyze the sensor data.
IQ3 Data Logger Dash Installation Manual Hardware Features External Dimensions 2.1” (5.3cm) 4.1” (10.5cm) 7.3” (18.6cm) 1” (2.
IQ3 Data Logger Dash Installation Manual External Features – Rear GPS Antenna Connector Deutsch 8 Pin Connector Serial Cable Connector Mounting Studs / Nuts (3 total) Vnet Connector GPS Antenna Connector Vnet Connector Deustch 8 Pin Connector Serial Cable Connector Mounting Studs & Nuts Provides connection for external GPS antenna Provides input for external sensor(s) Vnet cable Provides input for power / ground/ engine rpm / programming buttons Provides input for serial cable supplied with package T
IQ3 Data Logger Dash Installation Manual Mounting Template – Full Size 15
IQ3 Data Logger Dash Installation Manual 16
IQ3 Data Logger Dash Installation Manual Installation The design of the IQ3 greatly simplifies the installation process, as there is no external data logger or related components necessary. However, there are basic guidelines that must be followed, in order to insure correct operation of the product. Mounting Location The IQ3 is designed to be utilized in a race vehicle environment and as designed as such.
IQ3 Data Logger Dash Installation Manual Mounting Orientation of IQ3 – When Used For Track Mapping Purposes The IQ3 contains inline, lateral and vertical accelerometers that perform two functions. First is for graphical analysis of G data. The second is to work in conjunction with the GPS data to provide track mapping information. The logger must be mounted in the direction shown below as the orientation of the G meters cannot be re-defined in the software, if mounting in any other direction.
IQ3 Data Logger Dash Installation Manual Power Supply and Grounding The IQ3 should be connected to a battery source that can supply a constant 10-16 volts. In vehicles that utilize a master power switch, it recommended to connect to the master power switch. This not only insures the IQ3 will be powered when the vehicle is in use, it also insures power will be disconnected in the event of an emergency. A good ground is very important to the function of the IQ3.
IQ3 Data Logger Dash Installation Manual Power/RPM/Programming Button Connector and Wiring The rear of the IQ3 contains an 8 position Deutsch connector. This connector provides the power and ground inputs, in addition to engine RPM, optional external program button inputs and external warning light output. The IQ3 is provided with the appropriate 8 position mating connector and wiring.
IQ3 Data Logger Dash Installation Manual GPS Antenna Mounting The GPS antenna is a moisture resistant, magnetic based type, designed to be mounted on the exterior roof of the vehicle. If no roof exists or the vehicle is of a composite type, insure the antenna is mounted in clear view of the sky, with no obstructions. The antenna must be mounted at the highest point of the vehicle and level front / rear and left / right.
IQ3 Data Logger Dash Installation Manual Programming the Display by External Buttons External Programming Buttons A variety of IQ3 display functions can be controlled, displayed or programmed through use of two external programming buttons known as Button 1 and Button 2. This enables the driver to make immediate changes, without the necessity of connecting a PC to the dash.
IQ3 Data Logger Dash Installation Manual Programming Modes Programming functions of the IQ3 are accessed by using Button 1 and Button 2. Button 1 is considered Left Button and Button 2 is considered Right Button. It is recommended the two programming buttons be mounted as Left and Right, in relation to the driver’s position viewing the dash. There are two programming modes available. Setup Mode 1 (Stationary): Utilized to program items such as screen brightness or pulses per revolution (tach programming).
IQ3 Data Logger Dash Installation Manual Setup Mode 1 (stationary programming) Setup Mode 1 is used to program the unit without the need to operate the vehicle. Entering Setup 1 1. Press and hold Button 1 (left button) for TWO shift light blinks – MEDIUM press 2. The Dash will display SETUP 1? 3. Confirm by pressing Button 1 for ONE shift light blink – SHORT press The following are in the order in which the individual programming features will appear.
IQ3 Data Logger Dash Installation Manual Setting as Displayed on Dash Program Setting Description Programming Command Medium Press Button 2 Decreases by 5 Requires tach signal Recommend programming in Setup Mode 2 TIME ZONE GMT SPEED UNITS S/F DETECT 10/20/40/80/160/320 DEFAULT DISPLAY Accept and Exit Short Press Button 1 Long Press Button 1 Short Press Button 1 Long Press Button 1 Short Press Button 1 Long Press Button 1 Short Press Button 1 Long Press Button 1 Short Press Button 2 Advan
IQ3 Data Logger Dash Installation Manual Setup Mode 2 (moving programming) Setup Mode 2 allows the user to utilize inputs from the moving vehicle, in order to automate the programming process. The following are in the order in which the individual programming features will appear. Entering Setup 2 1. Press and hold Button 2 (right button) for TWO shift light blinks – MEDIUM press 2. The Dash will display SETUP 2? 3.
IQ3 Data Logger Dash Installation Manual Setting the Start/Finish Location There are two methods you can use to set the start/finish location. The first method is to use the external programming buttons. The second method is to use the DataLink software to write the start/finish location to the microSD card. The second method is explained later in the manual.
IQ3 Data Logger Dash Installation Manual Downloaded Data: Stored IQ3 data is downloaded to the user’s PC by means of the IQ3 microSD memory card. Before the data can be opened into the DataLink software, it must first pass “through” the Configuration file. Configuration File: The IQ3 Configuration file, contained within the DataLink program, is automatically loaded with the installation of the DataLink software.
IQ3 Data Logger Dash Installation Manual PC Software Requirements The DataLink II software is compatible with Windows 98 Second Edition, ME, 2000, XP and Vista 32. If you have a Windows operating system other than those listed above please contact Racepak for additional installation assistance. DataLink is not compatible with Apple. Software Installation To install the DataLink II software on your PC, perform the following. 1. Turn on the computer and start Windows. 2.
IQ3 Data Logger Dash Installation Manual DataLink II Help Files The DataLink II software includes a complete selection of help files, which can be accessed as shown below: Main Menu or any open Dialog Box: To get help for any of the menu items simply highlight the menu item by placing the mouse cursor over the menu item. Next press the F1 key to display the help. Icon Tool Bar: Select the ? button located at the bottom of the icon toolbar.
IQ3 Data Logger Dash Installation Manual Serial Com Port Settings When adding Vnet sensors or programming advanced display functions of the IQ3 dash, it is necessary to connect the user’s PC to the IQ3 by means of the supplied Communication Cable. The DataLink software is set from the factory to communicate through COM1 (standard serial port com number). If your PC is using a different com port number, it will be necessary to match the DataLink and PC com port settings. 1. Open the DataLink II program.
IQ3 Data Logger Dash Installation Manual Data Logger and Dash Setup Using DataLink Software Access to data logger, sensor and dash programming functions are contained within the configuration file. At the time of the DataLink software installation, a set of motorsport specific configuration files were also installed.
IQ3 Data Logger Dash Installation Manual Programming Functions – Data Logger The configuration file should now be open in the DataLink software, as shown below. A configuration file is always noted by the blue “wrench” tab seen at the top of the file. Note the Channel Buttons across the top of the configuration file. Any internal or external sensor, gauge or dash programming functions is accessed through this file.
IQ3 Data Logger Dash Installation Manual Programming the Display Using the DataLink Software Many display functions of the IQ3 can be programmed utilizing the two external programming buttons, as outlined in the Programming the Display By External Buttons section of this manual, page 24. However, it is also possible to program many of these same functions along with additional functions, utilizing the user’s PC and DataLink program.
IQ3 Data Logger Dash Installation Manual Display Pages A view representing the current programming of all four display pages is obtained by selecting the Display Pages tab. Each input is programmed by selected the text box related to that input area, as indicated by the red line extending down to the dash, from each text box.
IQ3 Data Logger Dash Installation Manual Warnings The IQ3 provides the ability to program up to four individual warning channels. The face of the dash contains four warning lights. Each warning light is associated with a single warning channel. To program each individual warning channel. 1. Select the “Warnings” tab. 2. Next, left click on the warning light you would like to program. This action will open the Warning Light text box.
IQ3 Data Logger Dash Installation Manual Example Warning Setup As noted in the previous section, the dash warning setup allows the user to trigger a warning light based on one sensor channel or two sensor channels. In addition, a specific text warning may be programmed to display, when the warning parameters are met.
IQ3 Data Logger Dash Installation Manual Shift Lights To program the shift lights, simple determine the RPM Channel to activate the shift lights (typically Engine RPM) then select the shift point for each gear. Finally, select the RPM Interval between each shift light. Example: Shift point for each gear is 5000 RPM. Interval is 100 RPM.
IQ3 Data Logger Dash Installation Manual Slip Calculation The Slip Calculation provides the ability to display slip data based on propeller vs. speed or tire vs. speed for use with wheel driven vehicles. The slip calculation can only be used for display purposes. It is not recorded on microSD card. If you need to record a slip calculation, you can create one via the DataLink software math channel feature.
IQ3 Data Logger Dash Installation Manual Dash Info The Dash Info contains setup parameters, specific to the dash and data logger. Locate the Custom Programming Options area. This is found on the left side of the page. To change any of the following parameters, place the mouse cursor on the desired text line and left click. This will activate the input box for the particular setting, to the right of the selected text line.
IQ3 Data Logger Dash Installation Manual Odometer Input Channel If you would like to enable the odometer function, you must first define the speed channel used to calculate the distance traveled. You must remember that if you select GPS speed, the odometer will only be functional when the IQ3 has acquired three or more satellites. Real Time Sample Rate Defines the logging or sample rate when data is viewed in real time (live watch). Minimum is 1 and maximum is 100.
IQ3 Data Logger Dash Installation Manual Motorsports Specific Software Each type of motorsports places different demands on the software. As discussed on previously in this manual, Racepak has created three configuration files, designed to cover a variety of motorsports. The difference between the configuration files can be found in the Runlog page area, which is screen area located below the main graph area. Here, the user will find a variety of pages specific to their type of motorsports.
IQ3 Data Logger Dash Installation Manual Real Time Displays 1. Dash 2. User Gauges 3. On Track Telemetry Provides the ability to view data in an analog real-time format. Additional information can be found in the following sections. User Defined Runlog Pages 1. User Page 1 2. User Page 2 3. User Page 3 Provides the ability to create custom Runlog pages. Additional information can be found in the following sections. Car Setup 1. Chassis Scaling 2.
IQ3 Data Logger Dash Installation Manual Tire Data This Runlog page was designed to provide an area to input tire temperatures and pressure build up, during track test events. However, the Tire Pressure Cold data should be entered before the start of testing. Following a test run, if tire temp readings are obtained by means of a hand held probe, the individual temperatures can be inserted into this Runlog page. By doing so, the system can provide the following information: 1. Left Front Average 2.
IQ3 Data Logger Dash Installation Manual Write Start / Finish Position to Card The ability to export the start / finish location (as set in the GPS Trackmap) to the memory card eliminates the necessity of setting the start / finish from the external programming buttons. When the card is re-inserted into the data logger, this start / finish location is automatically installed in the data logger. To export the GPS Trackmap start / finish location to the data logger: 1.
IQ3 Data Logger Dash Installation Manual TrackVision Export Runlog Page This page allows the user to quickly export data from the DataLink software for use in the TrackVision video software. This is accomplished through the use of our TrackVision Export Runlog page. This page can be accessed by selecting the Track Vision Export button found on the Runlog Menu page, under the Favorite Log Page Shortcuts heading.
IQ3 Data Logger Dash Installation Manual Boat Racing Configuration Prop Data Math Channels: Racepak personnel have installed a set of math channels that provide data specific to boat racing analysis. This allows graphing and reviewing of prop data in the main graph area, but has no affect on Prop Slip settings as programmed in the dash. Prop Speed Channel name: Prop Speed The Prop Speed channel is derived from the input of Engine RPM, Gear Ratio, Prop Pitch and internal mathematical functions.
IQ3 Data Logger Dash Installation Manual Prop Data and Accel Reports 1. Prop Data 2. Accel Times 3. Accel Times Scroll Prop Data In order to activate the Prop Slip and Prop Speed data channels, it is necessary to complete the gear and prop data information contained on the Prop Data Runlog page. le. Accel Time and Accel Scroll Runlog Page 1. Open a Runfile and Graph GPS_MPH 2. Open the Accel Times Runlog Page 3.
IQ3 Data Logger Dash Installation Manual To utilize the Accel Scroll Runlog page, simply place the mouse cursor over the slider located at the top of the Accel Scroll Runlog page, right click and hold then drag the slider left or right to move the accel data accordingly. This feature allows the user to view data that extends out of view of the screen area. Real Time Displays 1. Dash 2. User Gauges 3. On Track Telemetry Provides the ability to view data in an analog real-time format.
IQ3 Data Logger Dash Installation Manual Write Start / Finish Position to Card The IQ3 config file provides the ability to export the start / finish location (as set in the GPS Trackmap) to the memory card. When the card is re-inserted into the data logger, this start / finish location is automatically installed in the data logger, thus eliminating the need to set the start / finish location with the Display Dash. To export the GPS Trackmap start / finish location to the data logger: 7.
IQ3 Data Logger Dash Installation Manual TrackVision Export Runlog Page This page allows the user to quickly export data from the DataLink software for use in the TrackVision video software. This is accomplished through the use of our TrackVision Export Runlog page. This page can be accessed by selecting the Track Vision Export button found on the Runlog Menu page, under the Favorite Log Page Shortcuts heading.
IQ3 Data Logger Dash Installation Manual Puller Runlog Pages Session Provides an input area for run numbering data, weather conditions and comments. Data is inserted by the user, as needed. Pull Info Provides an area to input pulled related information. Weather Provides an area to input weather information. Vehicle and Track Info Provides an area to input vehicle setup and track condition information. Dash Gauges Allows the user to select the input channel to activate each gauge.
IQ3 Data Logger Dash Installation Manual Making the Initial Run Downloading Data The IQ3 creates a new file and saves all data gathered from the start of logging (speed greater than 25 MPH) to the end of logging (speed less than 25 MPH for 30 seconds). Each file is saved in a .ddf format and is assigned a number based on date and time. Multiple files can be saved to the memory card. When a .
IQ3 Data Logger Dash Installation Manual Session Dialog Window When data is downloaded to the user’s PC, a download “path” must be created. This process automatically creates a series of folders for the downloaded data. The folders are named based on the number entered into the Year input box and the location entered into the Track input box. It is only necessary to enter the Year one time, according to the year of testing. It is also only necessary to enter the Track name one time, at each track.
IQ3 Data Logger Dash Installation Manual Map Select Dialog Window The Map Select Dialog Window is designed to assist the user in selecting previously created and saved GPS Track Maps. After extended use of the data system, it is possible to have quite a large collection of saved maps. However, the Racepak engineers have created a unique way to provide a limited number of maps for selection. Upon download of a new run, the Datalink II software reviews the location of the vehicle, relative to GPS data.
IQ3 Data Logger Dash Installation Manual 3. The final dialog window to be presented to the user is the Save window. This allows the user to review the save location and Runfile number. If any changes are desired, they made be performed at this time. If no changes are desired, select Save. At this time, the Runfile is now open the DataLink II software. The next step is to create a GPS track map.
IQ3 Data Logger Dash Installation Manual Pulling Data - Setting the Zero Start Point - Very Important In order for puller competitors to accurately review data, it is necessary to reset the start of graphed data (Zero Point) for each run. When data is initially downloaded and graphed, the starting point of the graphed data is when the data logger started saving data to the compact flash card.
G2X Pro Installation Manual Create Trackmap (Closed Course) Oval and Road Racing Upon download of the initial run, it is advisable to quickly check two channels, to verify system operation. Two suggested channels are the GPS_MPH and GPS_Satellites. Typically, if those two channels are correct, all the remaining GPS functions will be correct. At this time, the initial run should be in view, in the DataLink II software. To graph the GPS_MPH channel: 1.
IQ3 Data Logger Dash Installation Manual If no previously save track map exists for the newly downloaded data, the next action that must be performed is the creation of a GPS track map. A GPS track map is the most important item for data review, as the track map controls all of the timing functions of the logger and DataLink II software. Without a GPS track map, no lap times, segment times or visual driving lines will be available.
IQ3 Data Logger Dash Installation Manual Step 2: Select Track Type The next step is to assign the type of track in use for testing. Most all testing will be considered the default setting of Closed Course. Open Course is typically used for events such as Autocross and Hill Climbing, which is covered in the following section. Step 3: Set Lap Start As discussed in the previous section, the current data in view represents the GPS position of the vehicle from the start until the end of recording.
IQ3 Data Logger Dash Installation Manual Track Map Creation (Open - Autocross, Solo & Hill Climb) Through the use of GPS signals, it is possible to create a track map, even if the start and finish line are located at two different locations. In the previous section, we located the vehicle at the desired start / finish and selected the Set Lap Start button. For open course, we need to also establish an end point of the lap, also.
IQ3 Data Logger Dash Installation Manual Add Map Segments - Closed Course Tracks Only Now that we have created a GPS track map, the next step is to create track segments. In order for the DataLink II software to provide segment data, it is necessary to break the track into corners. Each corner will represent the start and end of a timing segment. However, in this instance, we will use Lateral G forces to create the segments for us.
IQ3 Data Logger Dash Installation Manual Step 3: Manually Edit Segments It is also possible to manually name a particular turn, override the assigned name to a particular area of the track or creating additional segments by using the Manual Segment Edit. To do so: 1. Position the location of the vehicle (as noted by the X on the track map) in the desired change area. Select Divide. Move the cursor to the desired ending point of the change select the Divide button again. 2.
IQ3 Data Logger Dash Installation Manual Add Inside / Outside Track - Optional When utilizing GPS data, it is possible to create on-screen inside and outside track edges, to assist in reviewing data. To obtain data for inside / outside driving lines, it is necessary to drive at least two complete laps on the inside of the track and two complete laps on the outside of the track. If the start / finish area is not passed at least two times during each procedure, a suitable lap will not be obtained.
IQ3 Data Logger Dash Installation Manual Manually Loading GPS Track Maps The DataLink II software enables the user to create any number of track maps. For example, it is possible to take the data utilized to create the previous track map and create another map with different segments, corner names, etc. Typically, only one map per track is necessary.
IQ3 Data Logger Dash Installation Manual Opening a Lap and Graphing Data: Road Racing/Circle Track/ Boats At this time, we have downloaded our first run, made a quick check of data and created and saved a track map. We would now like to review the basic procedures for viewing and graphing data. Before opening a lap for review, double click the Clear All Graphs icon, located in the vertical list of icons on the left side of the DataLink II screen. This will clear all currently graphed data.
IQ3 Data Logger Dash Installation Manual Distance Mode Graphed Data In order to produce a graph, a comparison must take place. When we previously graphed the GPS_MPH channel, the data was compared to time, which began at logging start and ended at power down of the logger. At this time, graph the GPS_MPH, GPS_LatG’s and GPS_Gs from your currently open lap. Since we now have a track map in place, the data will be graphed compared to time from the start / finish line.
IQ3 Data Logger Dash Installation Manual Speed and Segment Reports Following creation and segmenting of the GPS track map, the segment times will be now be available for review in the Runlog Page area. To view: 1. Insure a lap is open and in view 2. Select the Speed Summary Runlog Page tab, found at the bottom of the DataLink II screen. 3. Detailed information concerning segment times, entrance and exit speeds, along with minimum, maximum and average speeds are now available for review.
IQ3 Data Logger Dash Installation Manual Overlay (Graphing) Multiple Files At this point, we have reviewed the basics of how to open and graph a single file. We will now review how to open, graph and compare two files. Multiple files can be viewed simultaneously using the DataLink II software. To open another lap for review: 1. Place the mouse cursor over the current Runfile tab and right click. 2. Select the desired lap. 3. Left click the Open Selected button.
IQ3 Data Logger Dash Installation Manual Advanced features of the DataLink II Software At this time, the user should now be familiar with the basic skills necessary to create, download and review data. The following sections will review the advanced features of the DataLink II software. This information is intended to provide details concerning steps that can be taken to enhance the review of data, which in turn will assist in improving driver performance.
IQ3 Data Logger Dash Installation Manual Reference and Main Settings for Runlog Data Comparison Insure at least two Lapfiles are open. To assign the Reference and Main status to two laps, in order to provide comparison data with the Runlog pages: 1. Select any open lap as the Reference by placing the mouse cursor over the desired Lapfile tab clicking the center button on the mouse.
IQ3 Data Logger Dash Installation Manual Graph Scaling Explained Racepak technicians assign each channel a default minimum and maximum graph scaling value. As shown, GPS_MPH is set to graph data between 0 and 200 MPH. When testing/racing at various locations, different values are obtained. For example, the MPH obtained on a one mile track would be slower than the MPH obtained on a two mile track.
IQ3 Data Logger Dash Installation Manual Graph Scaling Values Changed per Channel The DataLink II program provides two methods to change graph scaling. The first method will change the scaling for one channel within one file. To change individual channel scaling: 1. Place the mouse cursor over the desired Channel Button and right click the mouse button. For this example, we selected GPS_MPH. 2. The Edit Dialog Box for that channel will be displayed.
IQ3 Data Logger Dash Installation Manual Chart Scaling Sets - Universal Scaling Settings The preferred method of graph scaling involves the creation of a Chart Scaling Set. A Chart Scaling Set is universal, in that it has the ability to override all current scaling values . The Chart Scaling Set applies the values to all selected channels, for all files, until removed by the user. 1. Select Settings, then Select Chart Scaling Set from the Main Menu selection. The following dialog box will be displayed. 2.
IQ3 Data Logger Dash Installation Manual Creating Graph Sets for Display - Quick Graphs Previously, we graphed data by placing the mouse cursor over the desired data channel and left clicking. Often times, users will find the need to graph the same set of channels, each time data is reviewed. It is possible to “build” graph sets that when selected, will automatically graph the desired channels. These files are called Quick Graphs. To create a Quickgraph: 1.
IQ3 Data Logger Dash Installation Manual How to Determine the Currently Graphed and Active Channel When graphing and reviewing multiple channels, the location of the mouse cursor in the Main Graph area is indicated by an X. The X represents the channel that the mouse cursor will follow, when moving left and right in the Main Graph area. As previously discussed, the Channel Buttons display the current values for each channel, according to the cursor position in the Main Graph area.
IQ3 Data Logger Dash Installation Manual Averaging Data Using the Averaging Cursor Action The DataLink II software will automatically calculate average channel data, according to the beginning and ending data displayed in the Main Graph area. There are times however, that a detailed look at data in a particular area is desired. This can be accomplished by placing Averaging Cursors within the Main Graph area.
IQ3 Data Logger Dash Installation Manual Graphing Data from an Entire Run There are occasions when it is necessary to review all of the data created during one test outing on the track (Runfile). Data from a Runfile may be graphed the same as data from a Lapfile. Often times, changes that occur are often easier to detect when reviewing the entire Runfile, as opposed to reviewing only one lap of information. To graph Runfile data: 1. Double click the Clear all Graphs icon from the Main Graph area.
IQ3 Data Logger Dash Installation Manual Zoom Command The Main Graph area as previously described displays an entire lap on the display screen. In many instances you may wish to zoom in on a particular area for a detailed analysis. Two methods are available. The first method is to create a zoom box using the right mouse button. To do so: 1. Determine the desired zoom area of the Main Graph. 2. Place the mouse cursor in the upper right corner of the desired zoom area. 3.
IQ3 Data Logger Dash Installation Manual Viewing Real Time Data (Telemetry) on your PC Data from your data logger can be displayed and recorded real time on your PC computer using the DataLink II program. A telemetry session is regarded much the same as a data file from an on-track run. The user will be presented with many of the same procedures that are utilized when downloading on-track data from the Compact Flash memory card.
IQ3 Data Logger Dash Installation Manual Note: The V_Net Sample rate of each of the modules to be monitored should be equal to or greater than the real time sample rate. If they are not, the last data points will be repeated during the sample process. Next select the Real Time Communications Port option and type in the name of the serial communications port on your PC you will be using to receive the real time data from the V_Net system.
IQ3 Data Logger Dash Installation Manual Starting a Telemetry Session The next step is to start a telemetry session. Select the Telemetry icon or the New Telem. Session menu item located in the File main menu election. A dialog box, as shown below will be displayed and you will then be asked to select the Configuration file to use for this session. Select your configuration file. A dialog box will then be displayed to allow you to enter the session information (the same as when downloading run data).
IQ3 Data Logger Dash Installation Manual The File Save dialog box will then be displayed. Select the Cancel button. Typically, there is no need to save a telemetry file. A new file tab with the channel data will be opened. Your real time data session is now ready. Next, insure the serial communication cable is connected between the data logger and the serial port on your PC selected above and power is supplied to the logger.
IQ3 Data Logger Dash Installation Manual Troubleshooting and FAQ The IQ3 is designed to provide trouble free performance. At times, problems could be encountered that may affect data. We have attempted to provide answers for some of the most common questions and problems. No Data Obtained During Run Data is written to the SD card when the start logging channel value is exceeded. The default setting is GPS MPH greater than 25 MPH.
IQ3 Data Logger Dash Installation Manual Does GPS Always Work? While GPS produces excellent data, no system is perfect. If the data logger is unable to acquire at least three satellites, data will not be useable. There are conditions that can affect signal reception. 1. Driving through a tunnel or any location that will hide or shroud the GPS signals. 2. Driving through an extensive row of trees, or other natural or manmade objects that might shroud signal reception for an extensive period of time. 3.
IQ3 Data Logger Dash Installation Manual Track Mapping Accuracy? GPS created track maps are created from vehicle position. The characteristics of GPS signals are such that the vehicle position accuracy is relative to the period of time the vehicle is in motion. For example, during an on track period of 10-15 minutes, the true vehicle distance could vary a distance of less than 12”. Over a period of hours, the worst case scenario for vehicle location to vary is 9 feet.
IQ3 Data Logger Dash Installation Manual I cannot set Start Finish with the dash? After the Set SF message is brought up on the display, attempt to set the start finish point within less than 1 minute. Best results are obtained by setting within 30 seconds. I lose satellites when I start to accelerate on the track? This is typically related to ignition interference. If the GPS data works at idle and driving slowly but is lost when the car accelerates, review the routing of the antenna cable.
IQ3 Data Logger Dash Installation Manual Conclusion We hope this manual has proved helpful to your entry into the usage of a Racepak data system. While the knowledge gained from our data system will provide beneficial to any race team, it is the desire to commit the time and effort to learning how to utilize the system that will prove most beneficial. As with any endeavor, the work invested in properly learning the usage of the system will pay dividends in the data the system will return.