
Installation manual


IQ3 Data Logger Dash Installation Manual
72
Graph Scaling Explained
Racepak technicians assign each channel a default minimum and maximum graph scaling value.
As shown, GPS_MPH is set to graph data between 0 and 200 MPH.
When testing/racing at various locations, different values are obtained. For example, the MPH
obtained on a one mile track would be slower than the MPH obtained on a two mile track. If
the MPH scaling was set to graph between 0-100 MPH, but 150 MPH was obtained during the
run, the MPH trace would go off the top of the graph, thus the importance of graph scaling.
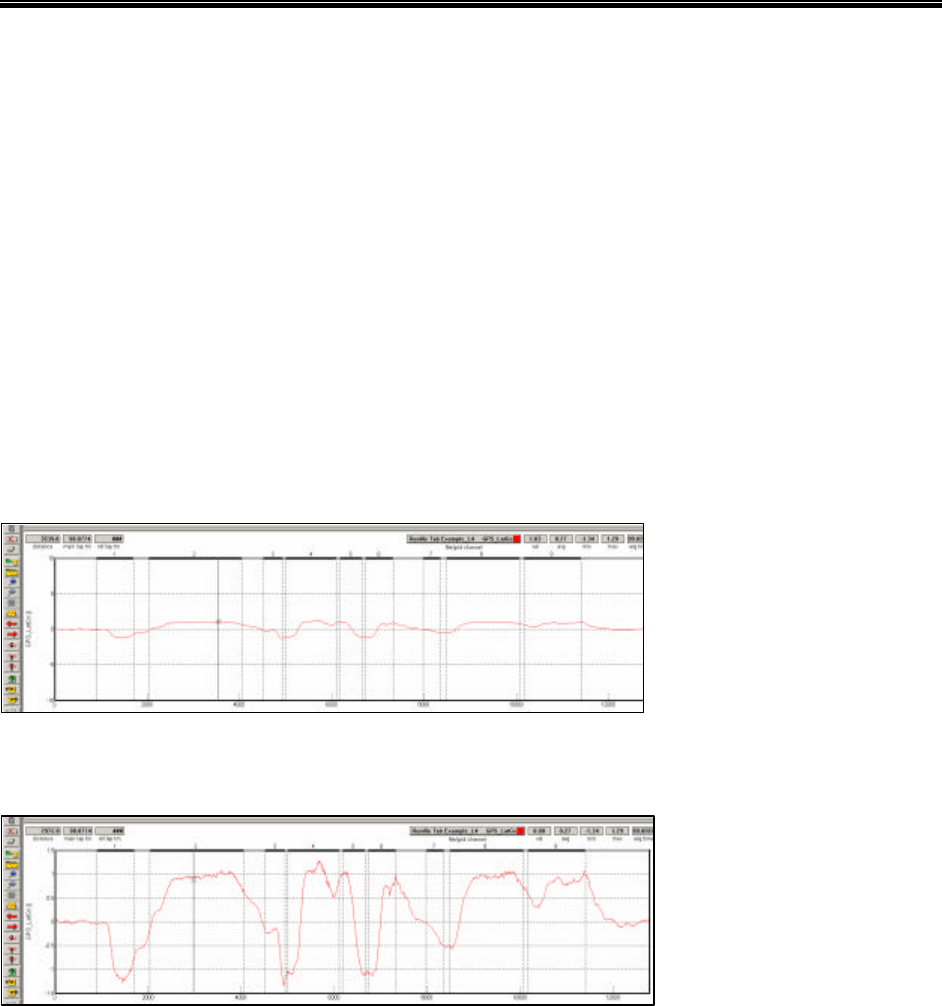
Let’s take a moment to discuss graph scaling. The visual rise and fall of graphed data is
determined by the scaling values. To provide a graphic example, look at the following two
graphs. Both are the same GPS_LatGs data, but with different scaling values.
GRAPH A
GRAPH B
Upon first glance, the data appears to be totally different channels. What appear to be small
changes in GPS_LatGs in Graph A suddenly become quite large and detailed changes in Graph
B. To improve performance using data acquisition, it is important to keep scaling values close
to the minimum and maximum values of the channel. It is very important to insure the same
scaling values, for the same channels are in place. If the above two channels with different
scaling values were overlaid, the user could easily interpret the data in an incorrect manner.
Remember, the above data is the same channel from the same lap, but with different scaling
values.
Scaling:
-10 to 10
Scaling:
-1.5 to 1.5