
Instructions

UM-0085-B09 DT80 Range User Manual Page 297
RG
So assuming that each day the modem spends 640 seconds idle and 20s actively sending then the additional daily
power use for the modem is, from Table 16, 640 x 1600 + 20 x 2500 = 1074000 mW.s, so the increase in overall average
power would be 1074000 / (24x60x60) = 13 mW
The total average power use would therefore be about 136 mW. However some additional margin would need to be
added to allow for communications retries and time spent online using dEX.
Note1: also that the logger is now spending an extra 680s awake each day, so you need to add this additional power. Assuming that the
logger is predominately in the idle state (350mW) during this time the average extra power is 680 x 350 / (24x60x60) = 3 mW
Note2: that peak power consumption could be much higher: 1300mW (core hardware, active power state) + 650mW (analog
subsystem) + 3500mW (modem), makes a total of about 5500mW (450mA @ 12V). It is necessary to ensure that the external battery
can deliver this current for a short period while maintaining its output voltage.
Example 6
The DT82EM3 in the previous example is reconfigured to send the data every 30 minutes. No minimum session time is
configured, and the minimum idle time is reduced from the default of 120s to 10s (the minimum setting).
There has been no change to the sample rate, so the average core power use remains at 120mW.
Only 5kbyte of data is now being sent each time, which will typically be transferred in less than a second, so it can be
ignored. However each day the modem now spends about 48 x (60+10) = 3360 seconds in the idle state (1600mW for
3G), as 48 times a day it now needs to power up and register (60s) then wait for the connection to be idle for 10s. During
this time the logger also needs to be awake, in its idle power state (350mW). So the total power usage is 120 + 3360 x
(1600+350) / (24x60x60) = 195 mW.
Incidentally, you could trim 15mW from this by forcing the modem to use a GSM connection (
PROFILE MODEM
SERVICE=GSM
), as the difference in data transfer time would be negligible but the idle power consumption is now
1200mW rather than 1600mW.
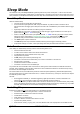
Battery Life
Once the average power consumption for the application has been calculated, we can estimate how long the DT80's
internal battery will be able to keep the logger operating.
For a lead acid battery, the battery voltage is relatively constant during discharge, then drops rapidly once the battery is
nearly flat. The DT80 will automatically enter an indefinite forced sleep mode once the terminal voltage drops below
about 5.5V. The "battery life" is therefore defined as the elapsed time between disconnecting external power and the
DT80 being forced into sleep mode.
The quoted capacity of a lead acid battery (e.g. 1.2Ah) is the energy that can be extracted from the battery at a 20 hour
discharge rate. In other words if you draw 1.2/20 amps (60 mA, or 360 mW) then the battery will last for 20 hours. It does
not follow, however, that if you draw 600 mA (10 times more) then the battery will last for 2 hours (10 times less). In fact it
will last for closer to 1 hour.
The maximum instantaneous discharge current for a lead acid battery is typically three times the capacity, i.e. 3.6A
(21W) for a 1.2Ah battery. (At this rate the battery life would be only about 3 minutes.)
At the other end of the scale (very low discharge currents), the self-discharge rate of the battery can become significant.
A lead acid battery will typically lose 3% of its capacity per month at 20°C (1.5% per month at 0°C, 10% per month at
40°C).
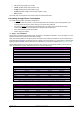
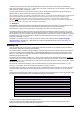
The following table takes all these effects into account, and can be used to estimate the life of a new, fully charged 1.2Ah
(DT80/81) or 4.0Ah (DT85) battery, given a calculated average power consumption:
Average power consumption from battery
Approx 1.2Ah battery life
Approx 4.0Ah battery life
5000 mW
0.5 hours
3 hours
2000 mW
2 hours
10 hours
1000 mW 5 hours 24 hours
500 mW
12 hours
48 hours
200 mW 36 hours 5 days
100 mW
3 days
10 days
50 mW
6 days
20 days
20 mW 15 days 45 days
10 mW
30 days
3 months
5 mW 1.5 months 5 months
2 mW
4 months
11 months
Table 18: Approximate lead acid battery life
The above assumes a battery ambient temperature of 20°C.
At 40°C, the battery life will be slightly improved at high discharge currents, but will be significantly shorter at low
discharge currents, due to the accelerated self-discharge rate.