
User guide

CarChip Online Help Printable Version
20
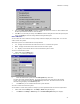
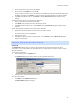
2. Click the Draw Braking Events check box to toggle the function on and off. A check indicates that
the Draw Braking Events function has been enabled.
3. Click OK to save the new plot setup. Click Cancel to exit the dialog box and retain the previous plot
setup. Click Apply to make the change without exiting the dialog box.
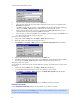
Draw Plots As Lines
The Draw Plots As Lines check box in the Setup / Plots dialog box displays the trip and plot
information in lines in the Trip Log Plot view when selected.
If the Draw Plots As Lines box is selected from the Setup / Plots dialog box, the plot information is
displayed as a black line. If the Draw Plots As Lines box is toggled off, the area under the plot line is
filled black.
To display lines in the plots:
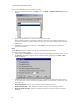
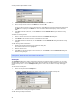
1. Select Plots from the Setup menu. The Setup / Plots dialog box displays.
2. Click the Draw Plots Using Lines Rather Than Areas check box to toggle the function on and off.
A check indicates that the Draw Plots Using Lines function has been enabled.
3. Click OK to save the new plot setup. Click Cancel to exit the dialog box and retain the previous plot
setup. Click Apply to make the change without exiting the dialog box.
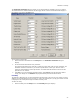
Draw Speed Bands
The Draw Speed Bands check box in the Setup / Plots dialog box displays the speed limitations set in
Set Speed Bands dialog box in the plots displayed in the Trip Log Plot view.
By selecting this option in the Setup/Plots dialog box, the speed bands are drawn in the plot. These
speed bands are represented in the plot by horizontal dotted lines. The two intermediate speed bands are
black dotted lines. The maximum speed band is a red dotted line.
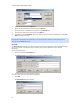
To display speed bands in the plots:
1. Select Plots from the Setup menu. The Setup / Plots dialog box displays.