
User Manual


iLM8 – Live User Manual
41
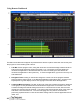
4. Per channel Short Term Average: Shows the short average of each channel on the graph. A
heavy vertical line shows where the target value on the iLM8 - Live is set. Each channel’s
reading is also shown in numerical form to the right of the graph, with the graph lines and the
numerical value changing color to show the level of loudness.
5. Status Bar: Three status boxes show more data that is collected from the unit. The left box will
display unit fault status. Clicking on the box will display the history of faults captured by the
Remote Dashboard software. The center box shows Mix Monitor status of the selected tab.
Clicking on the box will display the Mix Monitor history for that tab. The right box displays the
Remote Dashboard communication status. Clicking on this box, while connected to an iLM8 -
Live unit, will display additional information about that unit.
Log&Files&
!
The Remote Dashboard software’s main objective is to log your program audio loudness and have
those measurements available for compliance verification. A new log file is created each hour and runs
from x:00:00 to x:59:59. A new file will be created immediately if any data log options are changed.
By default, measurement data log files are saved in the “logfiles” folder under the main Remote
Dashboard application installation folder. A full day of logging each available data field once per second
will consume approximately 27MB of storage space. Storage of files onto flash drives or other solid
state storage devices is not recommended due to very frequent data writes the application makes and
the “write endurance” of these devices.
Logs are saved in Tab delimited format and can be imported into any database application that
supports the importation of external data. Log files may also be imported into Microsoft Excel or
Microsoft Access. The first line of each log file contains a column header that labels what data is
contained within that column.
Log File Import Example
This brief procedure will demonstrate how to import the log file data into Microsoft Excel and render
some simple graphs of the data. This procedure has only been verified to work in Microsoft Excel
versions 2000, 2003 or 2007.
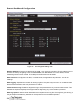
1. Open Microsoft Excel. In Excel 2007, click on the Data tab, and then click the Text button under the Get
External Data group. In Excel 2000 or 2003, click on the Data menu, click Get External Data and then
click Import Text File.
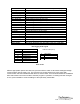
2 The Import Text File box will appear. On the bottom of the window, click the Files of type drop down
box and select All Files (*.*). Then, navigate to the location that the log files are stored in
and select the appropriate log file. Double click on the file name or select the file and press the
Import button.
3 The Text Import Wizard will start. Press the Finish button, as no values on these pages will
need to be modified.
4 The Import Data box will appear and ask where in the Excel sheet the data should be inserted.
Press the OK button to select the default location (Cell A1) or select the alternate desired
location and press the OK button.