
Specifications


3
Principled Technologies, Inc.: Virtualized Exchange workload performance comparison of end-to-end
solutions with iSCSI storage connections: Dell PowerEdge 2950 with Dell EqualLogic PS5000 vs. HP
ProLiant DL385 with HP Stora
g
eWorks EV
A
4400
Server
Total number of virtual
machines
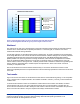
Dell PowerEdge 2950 server and Dell EqualLogic PS5000 storage array 17
HP ProLiant DL385 server and HP StorageWorks EVA 4400 storage array 14
Figure 3: The total number of virtual machines for the two server-and-storage solutions. Higher numbers are better.
Figure 4 shows the average response time from the median run for each virtual machine.
Server
Dell PowerEdge 2950 server
and Dell EqualLogic PS5000
storage array
HP ProLiant DL385 server
and HP StorageWorks EVA
4400 storage array
Virtual machine 1 302.50 929.73
Virtual machine 2 385.53 798.80
Virtual machine 3 361.85 580.22
Virtual machine 4 372.87 796.67
Virtual machine 5 373.67 849.42
Virtual machine 6 443.43 461.85
Virtual machine 7 401.00 670.22
Virtual machine 8 352.87 787.83
Virtual machine 9 323.43 813.45
Virtual machine 10 386.38 842.23
Virtual machine 11 451.48 750.32
Virtual machine 12 352.12 503.23
Virtual machine 13 387.00 596.42
Virtual machine 14 356.28 773.05
Virtual machine 15 313.38 N/A
Virtual machine 16 301.33 N/A
Virtual machine 17 435.03 N/A
Figure 4: Average response time from median run for each virtual machine for the two server-and-storage
solutions. Lower numbers are better.
Figure 5 details the power consumption, in watts, of the server-and-storage solutions while idle and during the
median run of the virtualized Exchange 2007 workload.
Server Idle power (watts) Average power (watts)
Dell PowerEdge 2950 server and Dell
EqualLogic PS5000 storage array
1,068.46 1,178.58
HP ProLiant DL385 server and HP
StorageWorks EVA 4400 storage array
1,020.88 1,146.76
Figure 5: Average power usage (in watts) of the server-and-storage solutions while idle and during the median run of
virtualized Exchange 2007 workload. Lower numbers are better.