
User's Manual


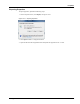

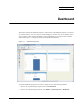

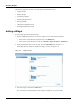
Table Of Contents
- Contents
- About This Guide
- Chapter 1
- Active System Manager Overview
- Chapter 2
- Getting Started
- Chapter 3
- Account Management
- Chapter 4
- User Profile Management
- Managing Security Functions
- Managing Groups
- Defining Permissions
- Modifying Permissions
- Managing Authentication Repositories
- Chapter 5
- Inventory Management
- Understanding Resource Modeling
- Building a Standard Active System Manager Inventory
- Configuring Discovery Setup
- Running Discovery
- Using Resource Types
- Using Resource Instances
- Building Resource Instances
- Modifying Core Properties for Resource Instances
- Modifying Resource Instance Resource Availability Dates
- Modifying Resource Instance Interfaces
- Displaying the Resource Availability Calendar View
- Deleting Resource Instances
- Setting Inventory Parameter Values
- Resolving Resource Dependencies
- Using Resource Interface Types
- Linking Resources
- Importing Inventory
- Importing Connectivity
- Exporting Connectivity
- Managing Resource Pools
- Managing Maintenance Windows
- Managing Virtual Resources
- Chapter 6
- Firmware Management
- Creating Active System Manager Software Repositories
- Updating Dell Chassis Firmware from the Operations Center
- Updating Dell Server Firmware
- Updating Dell Blade/Rack Servers Firmware from the Operation Center
- Updating Dell Blade/Rack Servers Firmware from an Active Session
- Updating Dell Blade/Rack Servers Firmware Using the Attach Server Profile Virtual Operation
- Updating Dell Blade/Rack Servers Firmware through an Orchestration
- Updating Dell Blade/Rack Servers Firmware Using the Attach Server Profile Custom Operation
- Minimum Firmware Versions for Active System Manager Components
- Chapter 7
- Server Template and Profiles
- Creating a Server Template
- Editing a Server Template
- Adding or Editing BIOS Information on a Server Template
- Adding or Editing RAID Information on a Server Template
- Adding or Editing Firmware Settings on a Server Template
- Adding or Editing Networks Settings on a Server Template
- Naming Conventions when using Orchestrations
- Server Profiles
- Chapter 8
- Using Inventory
- Chapter 9
- Repository Management
- Chapter 10
- Network Management
- Chapter 11
- Template Management
- Template Types
- Working with Templates
- Creating New Templates
- Saving Templates
- Changing Template Ownership and Permissions
- Opening Templates
- Closing Templates
- Deleting Templates
- Managing Template History Details
- Filtering Templates
- Validating Templates
- Importing Templates
- Exporting Templates
- Attaching a Template Image
- Scheduling Templates
- Archiving Templates using the Templates View
- Restoring Archived Templates
- Updating Templates using the Template Editor
- Viewing and Modifying Template Properties
- Adding Resource Types
- Setting Resource Type Properties for Scheduling
- Deleting Resource Types
- Adding Resource Types Based on Manufacturer Only
- Adding Resource Instances
- Modifying Resource Properties
- Deleting Resource Instances
- Defining Provisioning Policies
- Supporting Layer 2 Switching
- Using Annotations
- Updating Templates using the Link Editor
- Associating an Orchestration Workflow with Templates
- Chapter 12
- Session Management
- Introducing the Sessions Perspective
- Working with Running Sessions
- Scheduling a Session Using Templates
- Creating an Instant Session
- Opening Sessions
- Opening the Session Editor
- Using the Sessions Calendar
- Viewing Session Properties
- Editing Default Session Properties
- Assigning and Changing Session Ownership
- Canceling Sessions
- Deleting Sessions
- Purging Sessions
- Rescheduling Sessions
- Managing Session Links
- Handling Link Preemption
- Managing Session Resources
- Associating Scripts to Sessions
- Archiving Sessions
- Supporting Layer 2 Switching
- Saving Sessions
- Configuring Session Notifications and Reminders
- Starting and Stopping ASAP Rescheduling
- Managing Virtual Resources
- Chapter 13
- Orchestration Management
- Chapter 14
- Working with Test and Script Execution
- Chapter 15
- Reports
- Chapter 16
- Settings
- Chapter 17
- Dashboard

Managing Widgets
Dashboard 17-3
CPU/Memory Utilization
Over Time Graph for
Clusters
Displays CPU and memory utilization of clusters in percentage over a
give period of time (eg. Weekly, 3Days,Daily, Hourly).
To configure: start monitoring on the cluster; utilization data is pushed to
the database, utilization data is then retrieved, depending on time
intervals.
Note More widgets will be added in future releases.
Table 17-1 Default Set of Widgets (continued)
Widget Description