
Reference Guide


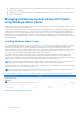
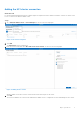

Table Of Contents
- Microsoft HCI Solutions from Dell Technologies: Managing and Monitoring the Solution Infrastructure Life Cycle Operations Guide
- Contents
- Introduction
- Day 0 Operations
- Azure onboarding for Azure Stack HCI OS
- Licensing for Azure Stack HCI for Windows Server 2016 and 2019
- Creating virtual disks
- Managing and Monitoring Azure Stack HCI Cluster using Windows Admin Center
- Installing Windows Admin Center
- Adding the HCI cluster connection
- Accessing the HCI cluster
- Viewing server details
- Viewing drive details
- Managing and monitoring volumes
- Enabling data deduplication on Storage Spaces Direct
- Monitoring and managing VMs
- Managing virtual switches
- Dell EMC OpenManage Integration with Windows Admin Center
- Prerequisites for managing AX nodes
- Installing the Azure Stack HCI license (Ready Nodes only)
- Managing Azure Stack HCI clusters
- Full Stack Cluster-Aware Updating prerequisites for AX-7525 and AX-6515 nodes (offline update)
- Full Stack Cluster-Aware Updating for Azure Stack HCI clusters using the OpenManage Integration snap-in
- Updating a stand-alone node before adding it to the cluster
- Known issues
- Firmware updates using Dell EMC OpenManage Integration for Microsoft System Center for System Center Virtual Machine Manager
- Firmware and driver updates using the manual method
- Restarting a cluster node or taking a cluster node offline
- Expanding the Azure Stack HCI cluster
- Extending volumes
- Performing AX node recovery
- Operating system recovery

Accessing the HCI cluster
To view the dashboard for the HCI cluster that you have added to Windows Admin Center, in the Cluster Manager window,
click the cluster name.
This dashboard provides the real-time performance view from the HCI cluster. This view includes total IOPS, average latency
values, throughput achieved, average CPU usage, memory usage, and storage usage from all cluster nodes. It also provides a
summarized view of the Azure Stack HCI cluster with drives, volumes, and VM health.
You can examine an alert by clicking the alerts tile in the dashboard.
Figure 5. HCI dashboard in Windows Admin Center
Viewing server details
To view the server details, click the tools pane and go to Servers > Inventory.
10
Day 0 Operations