
Deployment Guide
1. Connect to the switch and log in using an account with admin permissions.
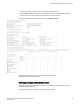
2. Enter mapsDb --show followed by the scope parameter: all, history, or details. Entering details
allows you to specify either a specific day or a specific hour of the current day.
The following example shows a typical result of entering mapsDb --show all.
switch:admin> mapsdb --show all
1 Dashboard Information:
=======================
DB start time: Sun Mar 30 20:46:59 2014
Active policy: dflt_moderate_policy
Configured Notifications: SW_CRITICAL,SW_MARGINAL
Fenced Ports : None
Decommissioned Ports : None
2 Switch Health Report:
=======================
Current Switch Policy Status: HEALTHY
3.1 Summary Report:
===================
Category |Today |Last 7 days |
--------------------------------------------------------------------------------
Port Health |No Errors |No Errors |
Fru Health |In operating range |In operating range |
Security Violations |No Errors |No Errors |
Fabric State Changes |No Errors |No Errors |
Switch Resource |In operating range |Out of operating range |
Traffic Performance |In operating range |In operating range |
FCIP Health |Not applicable |Not applicable |
Fabric Performance Impact|Out of operating range |In operating range |
3.2 Rules Affecting Health:
===========================
Category(Rule Count)|RepeatCount|Rule Name |Execution Time |Object |Triggered Value(Units)|
---------------------------------------------------------------------------------------------------
Switch Resource (1) |1 |defCHASSISCPU_80|03/30/14 20:50:00|Chassis|99.00 % |
4 History Data:
===============
Stats(Units) Current --/--/-- --/--/-- --/--/-- --/--/-- --/--/-- --/--/--
Port(val)
---------------------------------------------------------------------------------------------
CRC(CRCs) 0(>9999) - - - - - -
1(876) - - - - - -
ITW(ITWs) - - - - - - -
LOSS_SYNC(SyncLoss) - - - - - - -
LF - - - - - - -
LOSS_SIGNAL(LOS) - - - - - - -
PE(Errors) - - - - - - -
STATE_CHG - - - - - - -
LR - - - - - - -
C3TXTO(Timeouts) - - - - - - -
RX(%) - - - - - - -
TX(%) - - - - - - -
UTIL(%) - - - - - - -
BN_SECS(Seconds) - - - - - - -
Refer to MAPS monitoring categories on page 25 for explanations of the
categories listed in the dashboard output.
Viewing a summary switch status report
A summary view provides health status at a high level, and includes enough information for you to
investigate further if necessary.
To view a summary switch status report, complete the following steps.
Viewing a summary switch status report
Monitoring and Alerting Policy Suite Administrator's Guide 79
53-1003147-01