
Deployment Guide
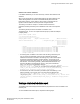
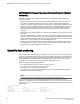

In the following extract, the last three lines list bottlenecks, with the final bottleneck caused by a timeout
rather than a numeric value. Be aware that the column headings in the example have been edited
slightly so as to allow the example to display clearly.
4. Rules Affecting Health:
===========================
Category(RuleCnt)|RptCnt|Rule Name |Execution Time |Object |Triggered Value(Units)|
-------------------------------------------------------------------------------------------------------
Port Health(12) |1 |defALL_OTHER_F_PORTSLR_10 |08/21/02 0:30:06|Port 23|11 |
1 |defALL_OTHER_F_PORTSLR_5 |08/21/02 0:29:54|Port 23|7 |
1 |defALL_OTHER_F_PORTSC3TXTO_3 |08/21/02 0:29:36|Port 23|57 |
1 |defALL_OTHER_F_PORTSC3TXTO_10|08/21/02 0:29:36|Port 23|57 |
6 |Bottleneck_stuckvc |08/21/02 0:30:24|Port 23|STUCKVC |
1 |Bottleneck_latency |08/21/02 0:30:20|Port 23|60 |
1 |Bottleneck_timeout |08/21/02 0:30:27|Port 23|TIMEOUT |
(output truncated)
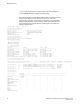
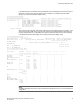
When a latency rule is triggered, the instance is listed as part of the Traffic Performance category. In the
“Front end port History Data” section, the five ports with the longest total backpressure times since the
previous midnight are shown, as illustrated in the following extract. Be aware that the column headings
in the example have been edited slightly so as to allow the example to display clearly.
4. Rules Affecting Health:
=================================
Category(RuleCnt) |RptCnt|Rule Name |Execution Time |Object |Trig Val(Units)|
Fabric Perf Impact (5)|2 |defALL_F_PORTS_IO_PERF_IMPACT |08/21/02 0:30:6 |Port 13|IO_PERF_IMPACT
08/21/02 10:30:6 |Port 22|
IO_PERF_IMPACT
3 |defALL_F_PORTS_IO_IMPACT_SEVERE|08/21/02 0:30:6 |Port 3 |
IO_FRAME_LOSS
08/21/02 10:30:6 |
Port 2 |IO_FRAME_LOSS
08/21/02 10:30:6 |
Port 4 |IO_FRAME_LOSS
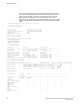
4.1 Front end port History Data:
=================================
Stats(Units) Current 07/21/13 07/14/13 --/--/-- --/--/-- --/--/-- --/--/--
Port(val) Port(val) Port(val)
---------------------------------------------------------------------------------------------
CRC(CRCs) 13(20) - - - - - -
ITW(ITWs) - 13(612) - - - - -
LOSS_SYNC(SyncLoss) - - - - - - -
LF - - - - - - -
LOSS_SIGNAL(LOS) 12(4) 12(4) 13(5) - - - -
- 13(4) 12(4) - - - -
- 14(4) 14(4) - - - -
PE(Errors) - - - - - - -
STATE_CHG 12(5) 12(5) 12(9) - - - -
- 13(5) 13(9) - - - -
- 14(5) 14(9) - - - -
LR - 13(6) 12(10) - - - -
- 12(4) 13(10) - - - -
- 14(4) 14(10) - - - -
C3TXTO(Timeouts) 10(80) - - - - - -
3(78)
126(77)
150(75)
18(75)
RX(%) - - - - - - -
TX(%) - - - - - - -
UTIL(%) - - - - - - -
BN_SECS(Seconds) - - - - - - -
DEV_LATENCY_IMPACT 0(52) - - - - - -
11(52) - - - - - -
16(52) - - - - - -
23(52) - - - - - -
NOTE
The MAPS dashboard will continue to log events whether RASLogs are set to on or off in the bottleneck
configuration.
Additional MAPS Features
Monitoring and Alerting Policy Suite Administrator's Guide 87
53-1003147-01