
Developers Guide


Fabric OS Troubleshooting and Diagnostics Guide 85
53-1003141-01
Switch status
10
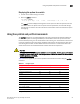
Viewing the overall status of the switch
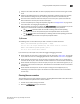
1. Connect to the switch and log in as admin.
2. Enter the switchStatusShow command.
ecp:admin> switchstatusshow
Switch Health Report Report time: 02/20/2008 06:02:51 PM
Switch Name: brcdDCXbb
IP address:192.168.234.63
SwitchState:DOWN
Duration:00:37
Power supplies monitorDOWN
Temperatures monitor HEALTHY
Fans monitor DOWN
WWN servers monitor HEALTHY
Standby CP monitor HEALTHY
Blades monitor HEALTHY
Core Blades monitorHEALTHY
Flash monitor HEALTHY
Marginal ports monitorHEALTHY
Faulty ports monitor HEALTHY
Missing SFPs monitor HEALTHY
All ports are healthy
For more information on how the overall switch status is determined, refer to the
switchStatusPolicySet command in the Fabric OS Command Reference.
If Flow Vision is enabled the following message appears:
ras225:FID128:admin> switchstatusshow
MAPS is enabled, Fabric Watch is disabled. Please use MAPS for monitoring and
execute mapsHelp command for available MAPS commands.
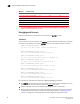
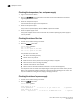
Displaying switch information
To display the switch information, perform the following task.
1. Connect to the switch and log in as admin.
2. Enter the switchShow command.
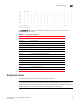
Table 15 lists the switch summary information.
TABLE 15
Switch summary information
Variable Definition
switchType Switch model and revision numbers
switchName Switch name
switchState Switch state: Online, Offline, Testing, or Faulty
switchMode Switch operation mode: Native, Interop, or Access Gateway
switchRole Principal, Subordinate, or Disabled
switchDomain ID: 0–31 or 1–23
switchId Switch embedded port D_ID