
Deployment Guide


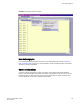
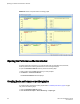

FIGURE 22 Canvas of six performance monitoring graphs
Opening the Performance Monitor window
To perform performance monitoring, you must use Web Tools with the EGM license; otherwise,
access to performance monitoring is denied and an error messages displays.
To open the Performance Monitor window, perform the following steps.
1. Select a switch from the Fabric Tree and log in when prompted.
2. Click Monitor > Performance Monitor.
The Performance Monitor window displays.
Creating basic performance monitor graphs
To create the basic performance monitor graphs listed in Predefined performance graphs on page
126, perform the following steps.
1. Open the Performance Monitor window.
2. Select Performance Graphs > Basic Monitoring > Graph Type .
Opening the Performance Monitor window
130 Web Tools Administrator's Guide
53-1003169-01